Original Article Vol. 1 No. 1 (2017): Int J Health Systems and Implementation Research
How to Avert Catastrophic Expense in General Ward Patients of Public Hospitals: Some insights from Tertiary Care Hospital
Downloads
Topics
Abstract
Introduction: Catastrophic expense estimation is done by the standard methods (40% of ability to pay or 10% total expenditure). This is of not much use for the hospitals and institutions who aim to improve financial protection for achieving UHC. In hospitals, patients with Below Poverty Line (BPL) cards are offered free treatment subject to restrictions. Patients generally bear the extra expense on medicines and supplies. Study was done to ascertain extent of OOP among general ward patients and to know impact of financial protection in terms of poor free status.
Methods: Data of 190 patients was collected at discharge from ‘General Ward’ of a tertiary care hospital of north India regarding their expense on medicines, supplies, diagnostics and user fees. Information on their poor free status, total household monthly income and expenditure, and total family members and earning members was also captured from them. They were asked if they had to take some loan or dispose of the assets for taking treatment.
Results: We found that although poor free status confers some protection; as overall medical expenses were lower in this group, but still even poor free have to incur huge expense and have to borrow money or dispose off assets. Huge expense is on medicines and also supplies. Institute offers substantial protection on user fee and diagnostics. Study also highlights the need to offer financial protection to NOT poor free patients in departments with diseases likely to incur large expense.
Full text
This web version was prepared from the published PDF, which is the version of record. Please cite and quote from the PDF.
Introduction
Affordable health care concept is not fundamentally different from what was conceived as per Alma Ata declaration about seven decades ago. World is still struggling to meet that great vision. During all these years, now we have better understanding and frameworks in the form of Universal Health Care Coverage. Lot of emphasis is now on equity and fairness in financial contribution. This is one of the important goal of the health systems. All countries are doing efforts to fill the cube of Universal Health Coverage (UHC), as per their situation and capacity. It implies to cover more population for health services, expand the scope of the health service interventions, and provide financial protection in a way to minimize Out of Pocket Expense (OOP). OOP has been given due importance in UHC. High OOP forces poor people either NOT to get treatment when sick OR leads to some financial catastrophe, which is unfair and inequitable.
One of the fundamental question is how to measure this financial catastrophe. Economists use two cutoffs for this: either >10% of total expenses on treatment OR >40% of capacity to pay, that excludes expenses on food item from total expenses. Look at this hypothetical example to appreciate and feel these definitions. In this table there are three categories of families: Low expense, middle expense and high expense. Total expense has been divided into food and non food groups. Catastrophe cutoff values have been calculated applying both definitions.
| Expense group | LowExpense | MiddleExpense | HighExpense |
|---|---|---|---|
| Food | 35 | 300 | 2000 |
| Non Food | 15 | 200 | 3000 |
| Total Expenditure | 50 | 500 | 5000 |
| 40% of Non food | 6 | 80 | 1200 |
| 10% Total | 5 | 50 | 500 |
There is a Low expense family, who barely spends one USD on food per day. Any medical expense more that 5-6 USD will cast catastrophe. Even simple episode of cough and cold or diarrhea will incur expense more than this. There is no buffer available. These families struggle to save on food and other items. For middle expense group, there is some buffer available, but any admission of 1-2 days will cost more than 50-80 USD and incur catastrophe. Higher Expense group have higher buffers. But they may also experience catastrophe if not protected. Chemotherapy for a cancer treatment for one year at 4 weekly intervals may cost more than 2500 USD every month. !!
Different community based surveys have used these cutoffs and have used different methods to define the expenses. Despite these limitations, useful data can be generated to see impact of various policy measures on OOP. This table shows OOP in different countries differ a lot. (Table 2) Part of this variation is due to differing methods and definitions.
Countries chose different Financial protection mechanisms depending on various socio political factors. But except for few countries like Thailand, success rate was very limited. China implemented New Cooperative Medical Scheme. It was not successful to address CHE. Inclusion of essential medicines and supplies was beneficial but not fool proof (13). There was partial success in countries like Mongolia(14), South Korea (15), Nigeria (16) and India (17), with various insurance schemes. Thailand achieved success (18). But they have traversed long tedious path to strengthen the health systems and streamline various financing mechanisms. Thus, countries should continue efforts in this direction.
One of the concerns is how health facilities and hospitals can contribute to minimize CHE and OOP? With this in mind Jitali Randhawa et al did a small study to understand whether financial protection given to families has some impact on OOP or not? This paper tries to answer the question: how hospital administration can improve financial protection?
Methodology
Data was collected from 190 patients from general wards of tertiary care institute. There are two types of wards in the institute: General and Private. Low income families use General wards. We presumed catastrophe to have occurred if families had to take loan or dispose off their assets to get the treatment. We focused only on the direct expense on medicines, supplies, diagnostics, and user-fees. We used the term “Poor Free” as measure of financial protection. In India, for families with defined cutoff of income and assets, poverty line is defined. Families below this line are called Below Poverty Line (BPL) families. Such families are given BPL cards and they are entitled for many benefits including free treatment. Even such families have to incur expenses on medicines, supplies and diagnostics if these are not available in the health facility.
Daily visit was made to wards to enlist patients scheduled for discharge, review the files for treatment received and interviewed patients for expenses incurred, financial protection received and any evidence of catastrophe. There was no recall bias due to this method.
Results
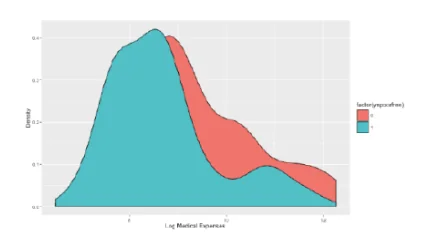
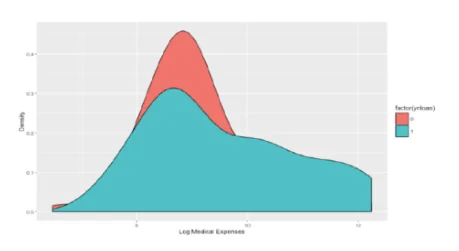
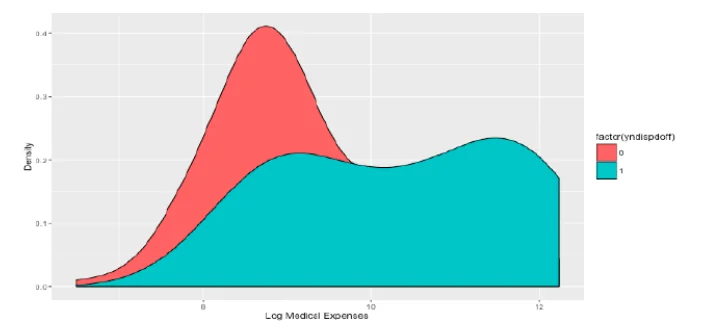
Table 3 show mean total medical expense with 95% CI. First column defines the two groups that were compared. For poor free status, Group 1 is those who were not poor free and Group 2 were poor free. Mean expense was substantially less among group 2 ( Poor free) than group 1 (those who were Not poor free.) Similarly, those who availed loan or disposed assets incurred larger expense.
| Group | Mean in Group 1 | Mean in Group2 | 95% CI | t value | P value |
|---|---|---|---|---|---|
| Gender ( Group1= Male, 2= Female) MedExp by factor(gender) | 26641 | 23726 | -92 to 15 | 0.47 | 0.6 |
| Poor Free Group1 = NotPoorFree(group0), Group 2= PoorFree(Group1) MedExp by ynpoorfree | 28612 | 13208 | 836 to 29971 | 2.08 | 0.03 |
| Loan Group1 = NotLoan(group0), Group 2= Loan(Group1) MedExp by ynloan | 18874 | 34965 | -27860 to - 4321 | -2.6 | 0.007 |
| Disposed Assets Group1 = NotDisposed(group0), Group 2= Disposed (Group1) MedExp by yndispdoff | 23267 | 61889 | -63224 to -14018 | -3.0 | 0.002 |
Kernel density plots visually show less expenses among poor free (Figure 1) and higher expenses among those who took loan (Figure 2) or disposed assets. (Figure 3). As financial protection and catastrophe can interact, we analysed the data to see this interaction. Figure 4 illustrates interaction of these variables.
Yellow and Red boxes show catastrophe in form of loan or disposing assets. Adjoining boxes show No catastrophe. Expenses among groups with Catastrophe were higher. First two boxes in each plot are for NOT poor free and last two are for poor free.
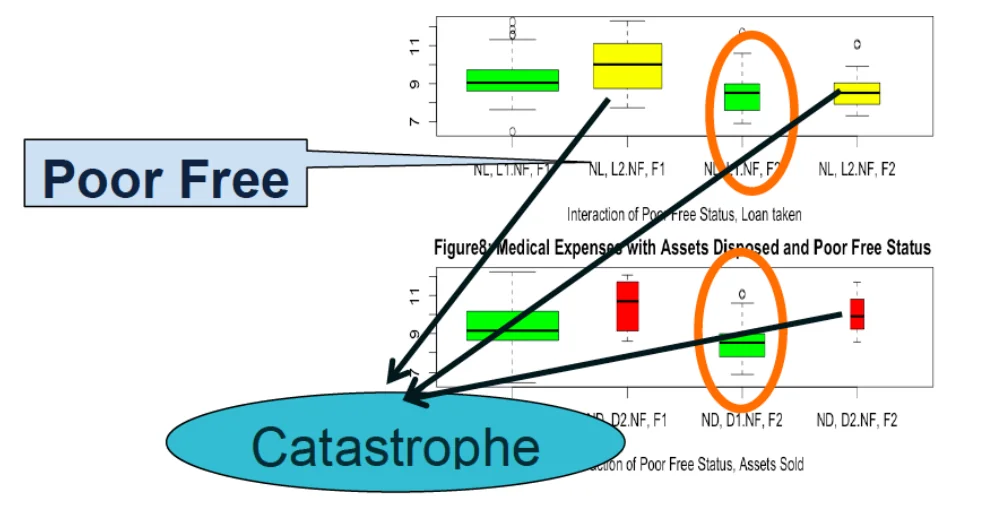
We found that both ‘poor free’ and ‘not poor free’ had to incur catastrophic expense. Further analysis on nature of expense and utility of financial protection, showed that poor free had very less expense for diagnostics, supplies and user fees. For medicines expense was not different for poor free compared to not poor free (data not shown). For catastrophic groups, expense was substantially higher on medicines and supplies.
Conclusions and Recommendations
In summary, our study showed that BPL status helped to reduce medical expenses on user fees, diagnostics and supplies. We also found that even BPL families had to take loans and dispose assets for treatment. We propose that health facilities should work on to identify top 10 costly conditions and develop comprehensive strategy which takes into consideration expected cost of treatment, per capita income or expenditure and does not depend only on BPL status.
Hospitals should devise mechanisms to consider per capita income and/ or expense and expected expenses on treatment and provide protection for atleast more costly disease conditions. At the same time, hospitals should work towards cost minimization by doing medical audits of costly disease conditions and work out comprehensive strategies. This may add value to existing financial protection strategies.
References
- Su TT, Kouyate B, Flessa S. Catastrophic household expenditure for health care in a low-income society: a study from Nouna District, Burkina Faso. Bulletin of the World Health Organization. 2006;84(1):21-7. Epub 2006/02/28. [Google Scholar]
- Bonu S, Bhushan I, Rani M, Anderson I. Incidence and correlates of 'catastrophic' maternal health care expenditure in India. Health policy and planning. 2009;24(6):445-56. Epub 2009/08/19. [doi:10.1093/heapol/czp032]
- Gotsadze G, Zoidze A, Rukhadze N. Household catastrophic health expenditure: evidence from Georgia and its policy implications. BMC health services research. 2009;9:69. Epub 2009/04/30. [doi:10.1186/1472-6963-9-69]
- Yardim MS, Cilingiroglu N, Yardim N. Catastrophic health expenditure and impoverishment in Turkey. Health Policy. 2010;94(1):26-33. Epub 2009/09/09. [doi:10.1016/j.healthpol.2009.08.006]
- Onoka CA, Onwujekwe OE, Hanson K, Uzochukwu BS. Examining catastrophic health expenditures at variable thresholds using household consumption expenditure diaries. Tropical medicine & international health : TM & IH. 2011;16(10):1334-41. Epub 2011/07/15. [doi:10.1111/j.1365-3156.2011.02836.x]
- Daneshkohan A, Karami M, Najafi F, Matin BK. Household catastrophic health expenditure. Iranian journal of public health. 2011;40(1):94-9. Epub 2011/01/01. [Google Scholar]
- Li Y, Wu Q, Xu L, Legge D, Hao Y, Gao L, et al. Factors affecting catastrophic health expenditure and impoverishment from medical expenses in China: policy implications of universal health insurance. Bulletin of the World Health Organization. 2012;90(9):664-71. Epub 2012/09/18. [doi:10.2471/blt.12.102178]
- Saito E, Gilmour S, Rahman MM, Gautam GS, Shrestha PK, Shibuya K. Catastrophic household expenditure on health in Nepal: a cross-sectional survey. Bulletin of the World Health Organization. 2014;92(10):760-7. Epub 2014/11/08. [doi:10.2471/blt.13.126615]
- Boing AC, Bertoldi AD, Barros AJ, Posenato LG, Peres KG. Socioeconomic inequality in catastrophic health expenditure in Brazil. Revista de saude publica. 2014;48(4):632-41. Epub 2014/09/12. [doi:10.1590/s0034-8910.2014048005111]
- Amaya-Lara JL. Catastrophic expenditure due to out-of-pocket health payments and its determinants in Colombian households. International journal for equity in health. 2016;15(1):182. Epub 2016/11/12. [doi:10.1186/s12939-016-0472-z]
- Choi JW, Kim JH, Yoo KB, Park EC. Association between chronic disease and catastrophic health expenditure in Korea. BMC health services research. 2015;15:26. Epub 2015/01/23. [doi:10.1186/s12913-014-0675-1]
- Piroozi B, Moradi G, Nouri B, Mohamadi Bolbanabad A, Safari H. Catastrophic Health Expenditure After the Implementation of Health Sector Evolution Plan: A Case Study in the West of Iran. International journal of health policy and management. 2016;5(7):417-23. Epub 2016/10/04. [doi:10.15171/ijhpm.2016.31]
- Guo N, Iversen T, Lu M, Wang J, Shi L. Does the new cooperative medical scheme reduce inequality in catastrophic health expenditure in rural China? BMC health services research. 2016;16(1):653. Epub 2017/01/06. [doi:10.1186/s12913-016-1883-7]
- Dorjdagva J, Batbaatar E, Svensson M, Dorjsuren B, Kauhanen J. Catastrophic health expenditure and impoverishment in Mongolia. International journal for equity in health. 2016;15(1):105. Epub 2016/07/13. [doi:10.1186/s12939-016-0395-8]
- Choi JW, Kim TH, Jang SI, Jang SY, Kim WR, Park EC. Catastrophic health expenditure according to employment status in South Korea: a population-based panel study. BMJ open. 2016;6(7):e011747. Epub 2016/07/28. [doi:10.1136/bmjopen-2016-011747]
- Ilesanmi OS, Adebiyi AO, Fatiregun AA. National health insurance scheme: how protected are households in Oyo State, Nigeria from catastrophic health expenditure? International journal of health policy and management. 2014;2(4):175-80. Epub 2014/05/23. [doi:10.15171/ijhpm.2014.39]
- Devadasan N, Criel B, Van Damme W, Ranson K, Van der Stuyft P. Indian community health insurance schemes provide partial protection against catastrophic health expenditure. BMC health services research. 2007;7:43. Epub 2007/03/17. [doi:10.1186/1472-6963-7-43]
- Weraphong J, Pannarunothai S, Luxananun T, Junsri N, Deesawatsripetch S. Catastrophic health expenditure in an urban city: seven years after universal coverage policy in Thailand. The Southeast Asian journal of tropical medicine and public health. 2013;44(1):124-36. Epub 2013/05/21. [Google Scholar]
Published
Article metrics
- Views
- 1,157
- Downloads
- 1,021
Based on this site's usage statistics.
Issue
Section
How to Cite
More in this topic: Health financing
Original Article · 2024
Stakeholders' Perception of Digital Payment in a Public Hospital in India