Original Article Vol. 4 No. 1 (2020): International J Health Systems and Implementation Research
Clusters of Under-Five Malnutrition Despite Overall Decline from 2010 to 2020: Geo-Spatial Depiction of Anganwadi Centre Data from Chandigarh, India
Downloads
Topics
Keywords:
- children
- malnutrition
- undernutrition
- underweight
- geographic mapping
- Geographic Information System (GIS)
Abstract
Background: Malnutrition, especially undernutrition presents a serious concern for developing nations such as India. Children are among the worst affected. With only a few years at hand to achieve global nutritional targets (2025), a renewed commitment is required in the monitoring and prevention of malnutrition. Objectives: To ascertain the decadal change in childhood (under-five) malnutrition in Anganwadi Centres (AWCs)/day-care centres of a city in north India using a Geographic Information System (GIS) based approach. Methodology: A comparative analysis was done using GIS mapping to study the decadal change in the nutritional status in selected AWCs in the study area from 2010 to 2020. Data regarding prevalence of moderate and severe malnutrition were collected from 60 randomly selected AWCs. Findings: Results were presented using comparative maps with bar charts and multivariate clustering using K-means algorithm. The overall percentage of moderate malnutrition in the 60 AWCs declined from 44.4% (2010) to 8.7% (2020); while for severe malnutrition a decline from 1.2% (2010) to 0.6% (2020) was noted. Conclusions: Overall, an improvement was seen in terms of both moderate and severe malnutrition prevalence in the AWCs assessed. The results however need to be seen in light of difference in classification and possibility of reporting errors. Recommendation: A GIS based approach can help program managers in identifying clusters with adverse rates of malnutrition; sort immediate areas of action and plan targeted interventions to pace up the reduction in prevalence of malnutrition. A lower prevalence of malnutrition translates to lower mortality of children under the age of 5 years.
Full text
This web version was prepared from the published PDF, which is the version of record. Please cite and quote from the PDF.
Introduction
Malnutrition results from an imbalance in intake or uptake of nutrients. Based on the deviation from standard, this imbalance is categorized as: undernutrition, and overnutrition. Though this dual burden is now widespread, the former is more severe for most developing countries. Wasting (low weight-for-height), stunting (low height-for-age), underweight (low weight-for-age) and micronutrient deficiencies are the major manifestations of undernutrition [1]. Stunting leads to an irreversible developmental damage in young children. Wasting though reversible (if treated), increases the likelihood of childhood mortality, especially when severe. In 2019, stunting affected roughly a fifth; while wasting affected around 7% of children under 5 years of age (U5), worldwide. In terms of both U5 stunting and wasting, Asian region is the worst affected (54%; 69%, respectively), even when compared to Africa (40%; 27%, respectively) [2]. Overall, nearly 45% of U5 mortality has been attributed to undernutrition, globally [3]. In India, 38% children under-five were stunted, as per the National Family Health Survey (NFHS-4) of 2015-16. Though the percentage of stunting has decreased by 10% over the previous survey (2005-06); wasting on the other hand has worsened marginally. About a fifth of U5 children in India are wasted. Percentage underweight declined from 43% to 36% over the two surveys [4].
Worldwide, the improvement in nutritional parameters has been very slow and unpromising [2, 5]. Stunting saw an improvement of only 10% in the past two decades. As per regional and global data on childhood malnutrition (stunting, wasting, and overweight), the world is lagging far behind for both World Health Assembly targets (for the year 2025) and the Sustainable Development Goals (for the year 2030) [2]. No country is set on track for overall achievement of 2025 nutritional targets [5].
In India, childhood malnutrition has been an important concern since many decades. In 1975, the Government of India (GoI), launched the Integrated Child Development Services, commonly known as the ICDS scheme. The ICDS scheme, falls under the Ministry of Women and Child Development (MWCD), GoI and covers children up to 6 years of age. The improvement of the health status and nutrition profile; and reduction in the incidence of malnutrition of the enrolled children, are among key objectives of the scheme. To this end, the scheme provides supplementary nutrition, and monitors growth of enrolled beneficiaries through community level day-care centres, known as Anganwadi Centres (AWCs) [6]. As the world’s largest developmental program for children, the ICDS is well appreciated nationally and globally [7]. Though debated by the MWCD, a 2011 based report by the then Planning Commission of India (PCI), found that the ICDS fell short of achieving an impact in improving the nutritional status in terms of Grade II, III, and IV malnutrition, which represent more severe forms of malnutrition. Moreover, in many states, the impact was in fact a negative one [8]. In 2017, the National Institution for Transforming India (NITI) Aayog (replaced PCI in 2015), GoI launched the ‘National Nutritional Strategy’. One of the key outcomes underlined in this strategy is a 15% reduction in U5 underweight percentage by the year 2022. The strategy also dictates, mapping of areas adversely affected in terms of nutritional status using Geographic Information System (GIS) in high-risk districts, under a ‘National Nutrition Surveillance System’ [9]. As a recent initiative, the ICDS scheme also shares the monthly report in public domain, along with geographic coordinates [6].
The year 2020 marks the mid of UN Decade of Action on Nutrition (2016–2025). With only a few years at hand to achieve national and international nutritional targets (2022, and 2025), a renewed commitment is required in the monitoring and prevention of malnutrition. Thus, we attempted to assess the areas of nutritional improvement and areas of persistent underperformance in our study setting, using the now in trend GIS technology. We conducted a study to ascertain the decadal change in childhood malnutrition in Anganwadi centres/day-care centres of a city in north India using a GIS based approach.
Methodology
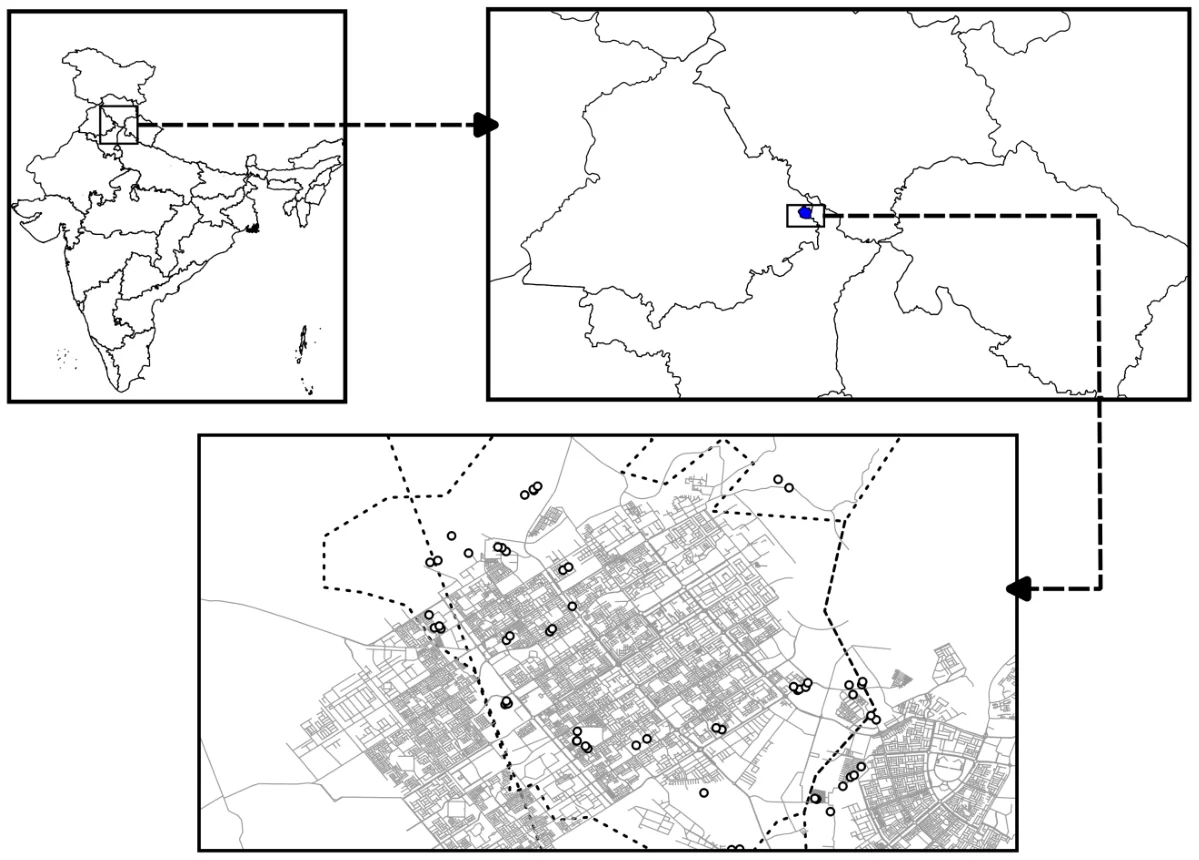
Chandigarh is a city in the northern part of India (Figure 1), governed directly under the central government of India (Union Territory). In the city, three ICDS ‘Projects’ are functional, having a total of 450 AWCs [10].
The study design was cross-sectional. Two separate assessments were done, approximately 10 years apart. In the year 2010, an assessment of AWCs was conducted in Chandigarh. In this study, data were collected from 20 randomly selected AWCs from each of the three ICDS projects. A total of 60 AWCs were thus sampled. The data were collected as a part of CTC monitoring project under National Institute of Public Cooperation and Child Development (NIPCCD), New Delhi. The number of enrolled beneficiaries (children) falling under Grade I, II, III and IV malnutrition were recorded from the registers maintained at AWCs. Data were compiled using Microsoft excel (Microsoft Office Home and Student 2019).
In March 2020, we identified the same 60 AWCs on the ICDS web-portal, under the ‘know your AWC’ tab [6]. Data were collected from the ‘Monthly Progress Report’ (MPR) for the month of February 2020, for each of these 60 AWCs (MPR for each month is updated on the portal in the consecutive month). We collected data regarding number of children (girls, boys) of age up to 3 years, and 3-5 years of age categorized as: normal, moderately malnourished (<-2SD up to -3SD), and severely malnourished (<-3SD), reported as per the WHO growth standards for weight-for-age. In addition to data regarding malnutrition, we also noted the longitudinal and latitudinal co-ordinates of each of the 60 AWCs. Data were compiled using excel sheets. The percentage of moderate and severe malnutrition in 2010 and 2020 was calculated for each AWC.
Malnutrition was compiled as Grade I-IV under the retrospective data (2010), while the secondary data collected from ICDS portal (2020) classified children as per WHO growth standards (weight-for-age) into moderate and severe malnutrition categories. We therefore searched the ICDS website for comparability of both datasets. A document with subsection, ‘Nutritional Status of Children under ICDS Scheme’, equated ‘Grade-I & Grade-II’ with ‘Moderately malnourished children’, and ‘Grade-III & Grade-IV’ with ‘Severely malnourished children’ [11]. Similar categorization was followed in a national report [8]. Another study that compared the nutritional status of U5 children in Chandigarh as per the grade-based Indian Academy of Pediatrics (IAP) classification and the newly launched (2006) WHO growth-reference standards also categorized ‘Grade-III & IV’ as severe underweight [12]. We therefore compiled nutritional status data from 2010, into ‘moderate malnutrition’ (Grade I-II) and ‘severe malnutrition’ (Grade III-IV). The findings are presented as Table 1. Furthermore, the geo-spatial analysis was also based on this conversion of grade-based classification.
| Children under 5 years of age | Year 2010, n (%) | Year 2020, n (%) |
|---|---|---|
| Normal | 2621 (54.4) | 4983 (90.7) |
| Moderately malnourished | 2140 (44.4) | 476 (8.7) |
| Severely malnourished | 57 (1.2) | 32 (0.6) |
| Total | 4818 (100) | 5491 (100) |
Some experts however prefer to equate IAP Grade II-IV malnutrition with severe malnutrition. This is based on the estimate that 1 SD for weight-for-age is approximately 10% of the median value of weight for the particular age. Therefore, IAP Grade I (weight between >70% - 80%) becomes equivalent to moderate malnutrition (between z-score of -2 and -3) and Grade II and below becomes equivalent (=<70%) becomes equivalent to severe malnutrition (z-score of -3 or less). We did an analysis according to this concept also, the findings are presented in Table 2.
| Children under 5 years of age | Year 2010, n (%) Categorization we followed in the study | Year 2010, n (%) Considering Grade I as moderately malnourished | Year 2020, n (%) |
|---|---|---|---|
| Normal | 2621 (54.4) | 2621 (54.4) | 4983 (90.7) |
| Moderately malnourished | 2140 (44.4) [Grade I+II-IAP] | 1563 (32.4) [Grade I-IAP] | 476 (8.7) [WHO <-2-3SD] |
| Severely malnourished | 57 (1.2) [Grade III+IV-IAP] | 634 (13.2) [Grade II+III+IV-IAP] | 32 (0.6) [WHO <-3SD] |
| Total malnourished | 2197 (45.6) | 2197 (45.6) | 508 (9.3) |
| Total examined | 4818 (100) | 4818 (100) | 5491 (100) |
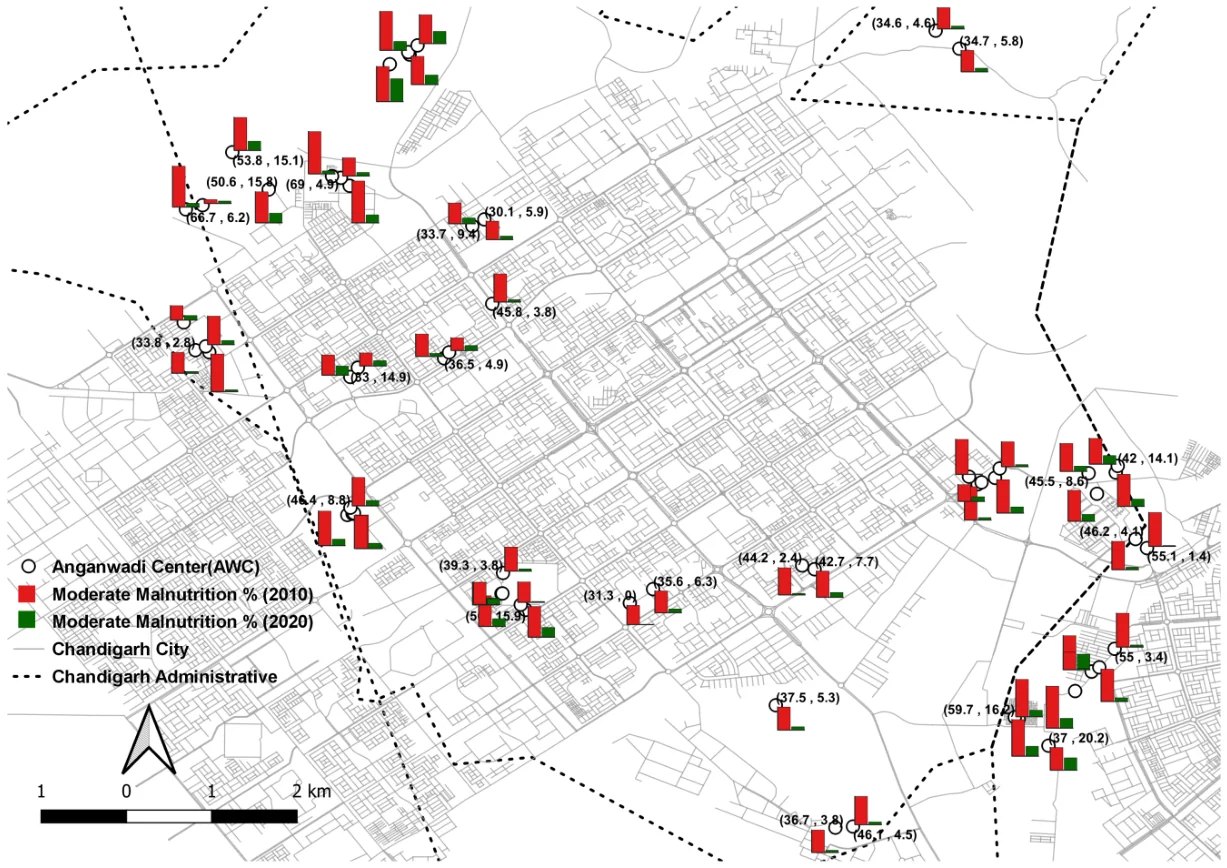
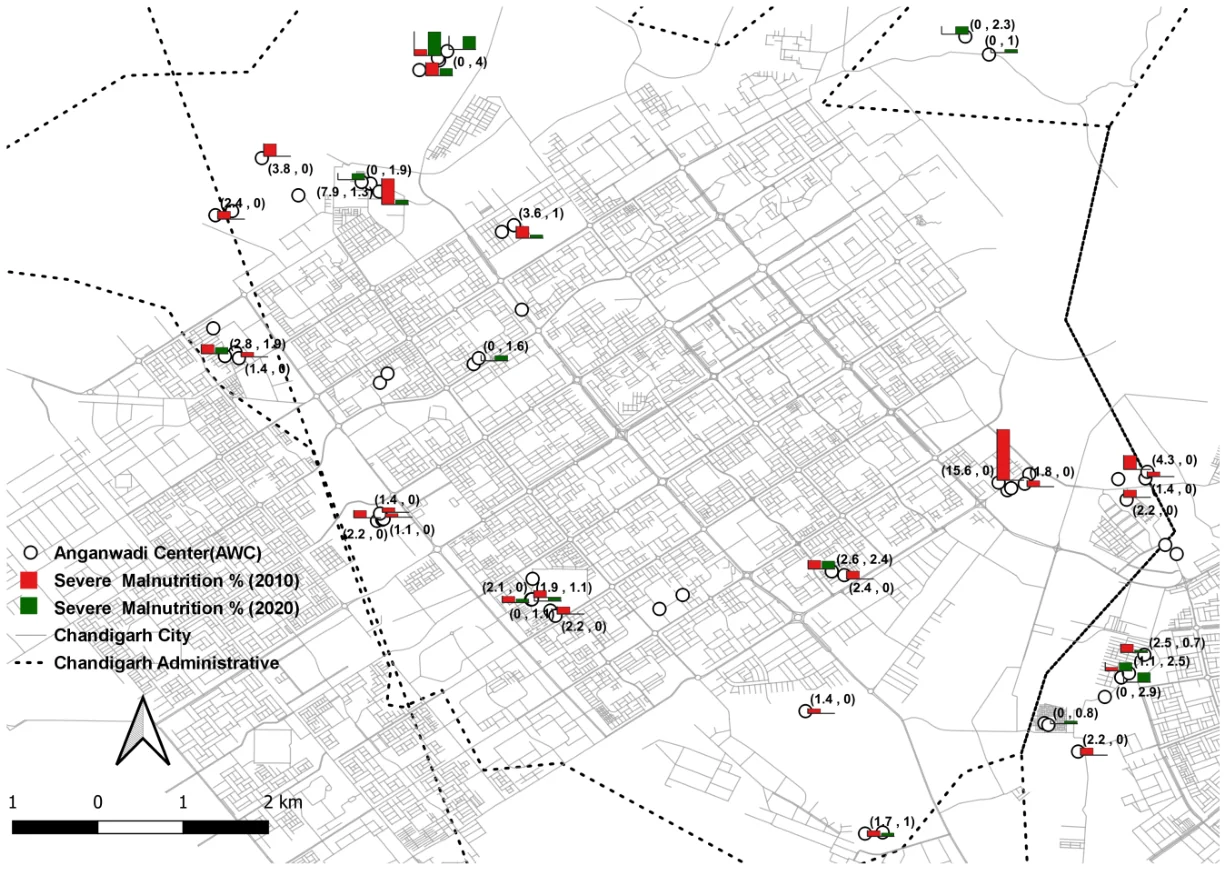
For comparing the rates of malnutrition in 2010 and 2020, all AWCs were geo-coded using the longitudes and latitudes obtained from the ICDS portal and also by physically visiting the AWC locations. The AWCs were plotted on Chandigarh shape files, using QGIS version 2.18.15 (QGIS Development Team, Las Palmas, (2016). QGIS Geographic Information System. Open Source Geospatial Foundation Project. http://qgis.osgeo.org). For comparing the prevalence of moderate and severe malnutrition across 2010 and 2020, the 60 AWCs were plotted on GIS using diagrams (bar chart), Figure 2 and 3, respectively.
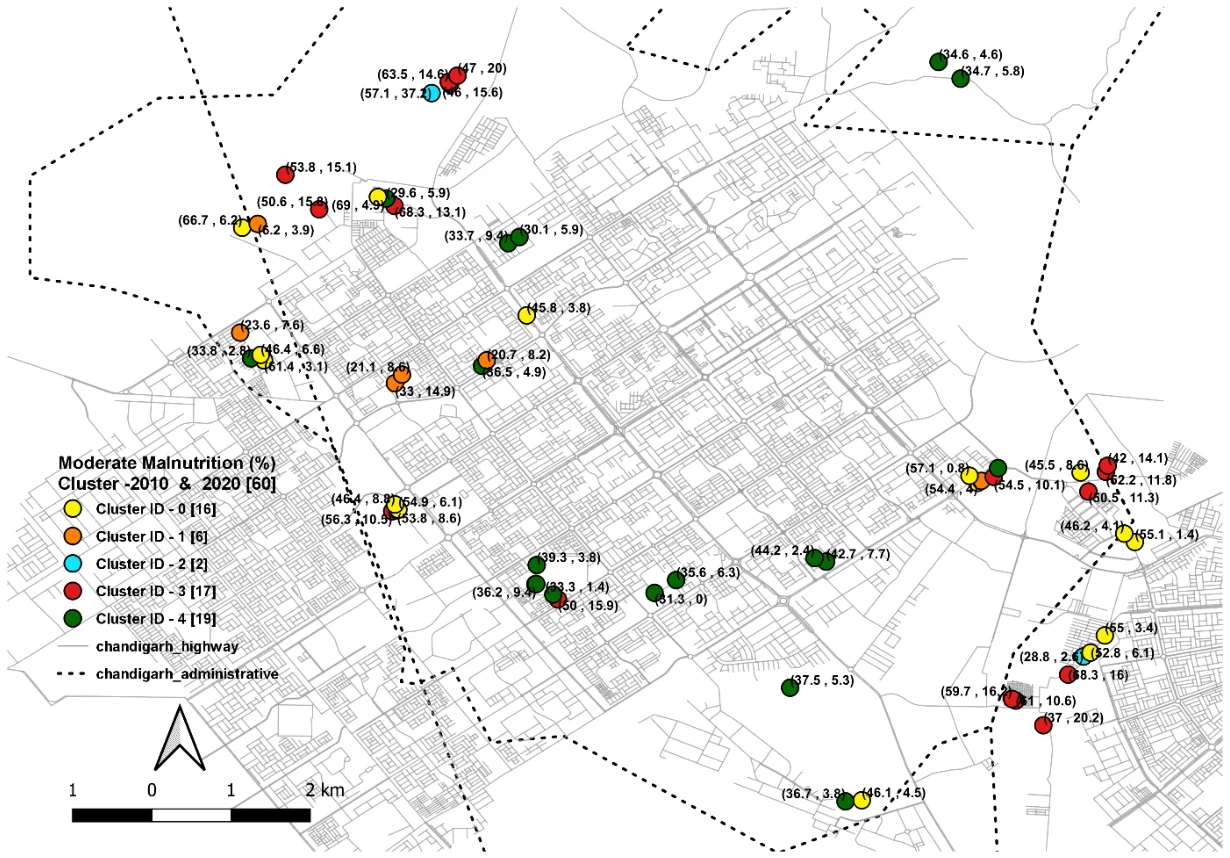
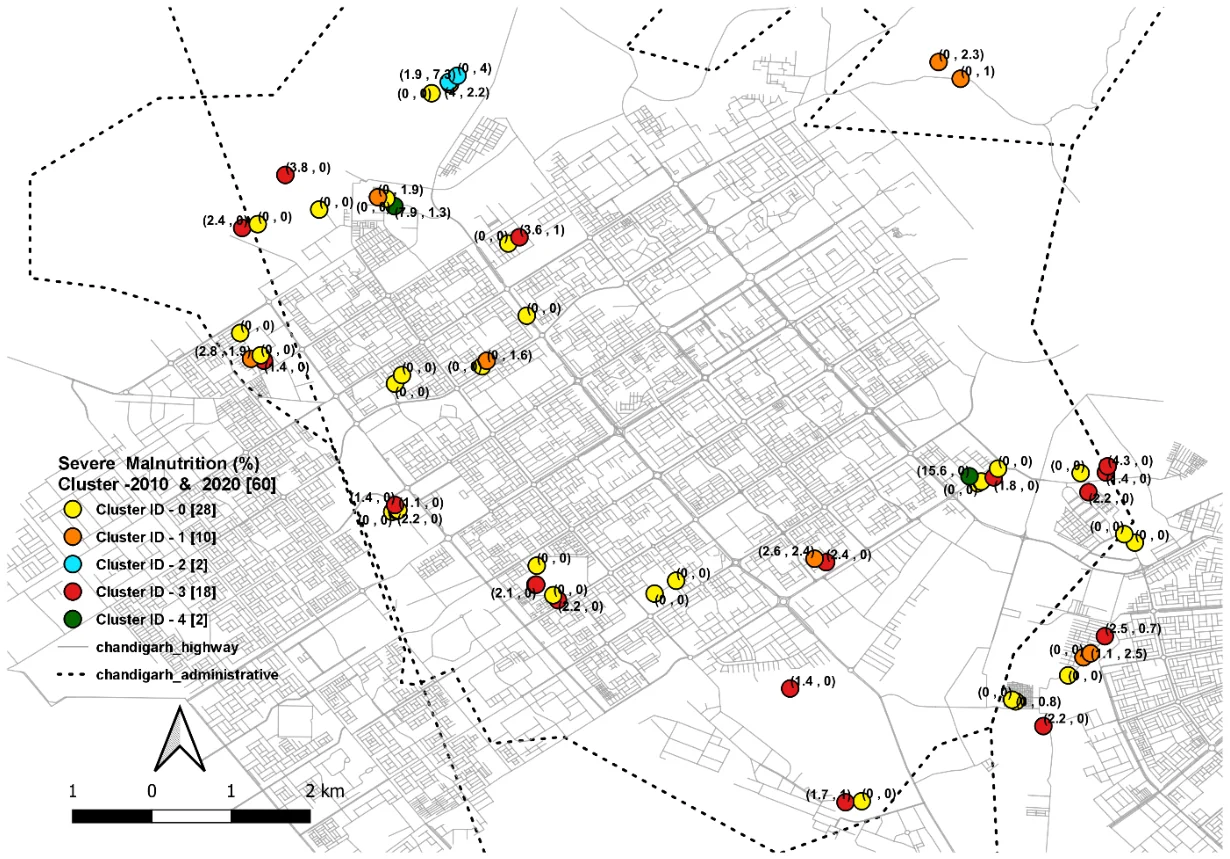
We also performed a multivariate cluster analysis for moderate and severe malnutrition using K-means algorithm [13]. Two cluster analysis maps (Figure 4 and Figure 5) were created using QGIS attribute-based clustering plugin [14] with percentage of moderate and severe malnutrition of 2010 and 2020 as attribute, number of clusters set to 5 and number of iterations set to default.
Findings
Descriptive Findings: In 2010, percentage of moderate malnutrition ranged from 6.2%-69%; while it varied from 0%-37.2% in 2020. The overall percentage of moderate malnutrition in the 60 AWCs declined from 44.4% (2010) to 8.7% (2020). For severe malnutrition, the range varied from 0%-15.6% in 2010; to 0%-7.3% in 2020. The overall percentage of severe malnutrition in the 60 AWCs declined from 1.2% (2010) to 0.6% (2020). The prevalence of severe malnutrition was 0% in 36 AWCs in 2010 and in 42 AWCs in 2020. Also, among total 60 AWCs, 58 AWCs in 2010 and 59 AWCs in 2020 had 0%-5% severe malnutrition. Table 1 represents the nutritional status among U5 children from the 60 AWCs.
Recategorization of malnutrition grading of 2010 data considering Grade I as moderate and Grade II-IV under severe malnutrition—leads to higher prevalence of severe malnutrition and decrease in the magnitude of moderate malnutrition. Accordingly, the decadal decline in severe malnutrition increased from 0.6% to 12.6% (Table 2).
Spatial Findings: Figure 2 and 3 present a comparison (using bar charts plotted on map) of moderate and severe malnutrition, respectively between 2010 and 2020. The initial value in label (red) represents the percentage of malnutrition in 2010, while the next value label (green) denotes the percentage of malnutrition in 2020. In the comparative map for moderate malnutrition (Figure 2) an overall decadal decline in the prevalence of moderate malnutrition is evident. However, the map for severe malnutrition (Figure 3), shows few AWCs in north, north-eastern and south-eastern part of the city with increase in prevalence of severe malnutrition.
The map representing multivariate cluster analysis of moderate malnutrition (Figure 4) depicts a total of five clusters with cluster ID starting with zero. The groupings have been done using percentage of moderate malnutrition in 2010 and 2020. Even though spatial position of AWCs plays no role in clustering, it is evident that south and south-east AWCs show clustering (cluster ID-0, cluster ID-3 and cluster ID-4).
Multivariate cluster analysis of severe malnutrition map (Figure 5) depicts a total of five clusters with cluster ID starting with zero. The groupings have been done using percentage of severe malnutrition in 2010 and 2020. Cluster analysis of severe malnutrition shows that AWCs in south and west side of the city predominantly maintain zero prevalence in severe malnutrition, cluster ID-0. AWCs with cluster ID-1and cluster ID-3 are mainly in north-eastern and south-eastern part of city.
Discussion
A GIS based comparative analysis of cross-sectional data was done to study the change in the nutritional status of children under-five in selected AWCs in Chandigarh from 2010 to 2020. An overall improvement in terms of both moderate and severe malnutrition, can be appreciated by comparing the maps (Figure 2 and 3). Nevertheless, despite improvement, peripheral AWCs remain areas for action when accounting for overall picture of malnutrition (Figure 2-5).
Malnutrition in Chandigarh is much lower than the national estimates. As per the NFHS-4 (2015-16), the total percentage of wasting, stunting and underweight among children under-five was 28.7%, 10.9%, and 24.5%, against the national average of 38%, 21%, and 36% respectively [4]. The data reported under AWC monthly reports is weight-for-age as per WHO growth standards, distributed into moderate and severe malnutrition by deviation from the reference standards (<-2-3 SD, <-3SD) [6]. We are thus unable to comment on important indicators like wasting (weight-for-height) and stunting (height-for-age); however, weight-for-age is a composite indicator that is influenced by both of these indicators. If wasting is insignificant at community level, weight-for-age and height-for-age can be interpreted similarly; both these exhibit the long-term nutritional status of the population [15]. In Chandigarh, around 28% of children under-five are reportedly wasted [4]. Based on these estimates, the prevalence of wasting in Chandigarh would fall under the ‘high’ category as per WHO [15]. Thus, it would be difficult to draw a likeness of weight-for-age and height-for-age in context of our study.
In 2015, the nutritional status of children under ICDS scheme in Chandigarh was 20.70% moderately malnourished and 0.61% severely malnourished; as opposed to national rates of 21.47% and 2.1%, respectively [10]. In our study, we found the overall rates of moderate malnutrition in AWCs declined from 44.4% (2010) to 8.7% (2020); showing an improvement of almost 12% (2020) over the ICDS 2015 estimates for Chandigarh. Severe malnutrition rate declined from 1.2% (2010) to 0.6% (2020); this shows that there hasn’t been much of an improvement over the ICDS 2015 estimates. However, if we consider the analysis by recategorizing the malnutrition grading (Table 2), there was marked decline in severe malnutrition also. Additionally, it is worth noting that in 42 AWCs this rate was 0%. For the remaining 18 AWCs it ranged from 0.7%-7.3%; three fourths of these AWCs were located away from the city centre. This signifies the importance of analyzing disaggregated data, especially along with spatial distribution.
A study by Thakur et al assessed the decadal change in prevalence of underweight among U5 children in Chandigarh. The study observed that the prevalence remained almost unchanged from 1997-2007 (51.6%; 50.4%, respectively) [16]. In 2009, Prinja et al, compared nutritional status of U5 children in Chandigarh as per the older Indian Academy of Pediatrics classification with the newly launched (2006) WHO growth-reference standards. They reported prevalence of underweight as 35.7% (WHO) vs. 50.2% (IAP); and severe underweight of 12.7% (WHO) vs. 3.3% (IAP) [12]. More recently Kumar et al (2015), reported 61.8% of the children surveyed to be underweight as per WHO growth standards [17]. GIS based approach for reporting nutritional status however remains largely unused in Chandigarh. Recently, two studies have harnessed this approach to identify high risk areas in terms of malnutrition at national level using data from the NFHS 4 [18, 19].
It remains a matter of concern that NFHS 4 (2015-16), reported wasting, stunting and underweight among under-five children of 28.7%, 10.9%, and 24.5% [4]. In our study, a decline in moderate malnutrition (underweight) from 44.5% to 8.7% within ten years looks hugely unrealistic. Although no direct parallel can be drawn between the two; NFHS being a community based survey, and our study was from the AWC records, still it may reflect either overall decrease in malnutrition in the community or decreased enrolment of malnourished children in AWCs or decreased reporting of malnutrition cases.
The results from our study should be interpreted with caution, more so as the data we analyzed were secondary. In 2010, the data were collected from record registers maintained at the AWCs while in 2020, the data were obtained from the ICDS portal. In this context the first issue that arises regarding both data is the ‘comparability’. In 2006, new growth-reference standards were released by the World Health Organization (WHO) to identify children with malnutrition; these standards were based on a set of studies that included data from breast-fed and appropriately fed children from developing countries [20]. In 2008, the GoI initiated the adoption of the WHO standards at ground level, replacing the grade based IAP classification [21]. However, grass-root level difficulties reportedly slowed the adoption of the standards [22]. The data available from 2010 were reported as ‘Grades’ of malnutrition in AWC registers; we therefore categorized the older grades into ‘moderate malnutrition’ (Grade I-II), and ‘severe malnutrition’ (Grade III-IV) categories based on available evidence [8,11–12]. However, caution has been suggested while comparing the grade-based IAP classification with the WHO growth reference classification based on z-scores [23, 24]. Prinja et al, reported the estimates for U5 underweight prevalence 1.4 times higher using IAP standards as opposed to WHO standards; in contrast, 3.8 times greater estimates of severe malnutrition were reported by WHO reference standards as compared to IAP [12]. In this light, careful consideration is warranted when interpreting the results from our study (Table 1), a decline of almost 35% in moderate malnutrition; from 44.4% in 2010 (based on IAP grades) to 8.7% in 2020 (based on WHO z scores) is thus overstated if we account the conversion factor from IAP grades to WHO reference standard based classification. On the other hand, as the estimates of IAP are a fourth of WHO estimates when accounting severe malnutrition [12], the actual decline in severe malnutrition from 2010 to 2020 would be far greater than 0.6%.
Secondly, it has been reported that certain AWCs maintain records despite absence of equipment/training for growth monitoring; while some others falsely record indicators despite the availability of accurate instruments, thus making data from records questionable in context to ground reality [8]. Third, despite data being available for all AWCs under ICDS portal (2020), we had to limit our comparative analysis to only 60 AWCs due to the retrospective 2010 data. Furthermore, we did not have many parameters for comparison owing to: a) limited indicators available from retrospective data (2010), b) limited indicators available form data collected from portal (2020) and c) incomparable indicators.
Nevertheless, we consider the simplicity of our study strength. We used publicly available data, free shape files and free software for map generation. As the ICDS portal now provides geo-coordinates of AWCs [6], maps like these can be generated easily with a basic knowledge of the GIS software. Since both the source of data and the software are free of cost; and the data is available at monthly interval, a comparative GIS based analysis can be easily replicated without a cost-intensive setup. Program managers and researchers can readily review the progress of AWCs as per selected indicators at a glance at more disaggregated levels of management (districts, talukas). Furthermore, clusters with adverse rates can reveal immediate areas of action and may in certain cases hint the root cause of poor performance. For example, overlaying important geographic features like national expressways, roads, other landmarks can reveal problems like inaccessibility, tough terrain, etc. in areas with higher clustering of adverse outcomes. Maps are one of the most effective forms of data presentation, such maps can thus be translated to time-saving and effective presentations at policy- advocacy level. Despite a desirable decline in malnutrition over the decade, the change we noted remains arguable. On one hand the contrasting classification systems used during the two time periods incite doubt; while on the other reporting errors—whether inadvertent or intentional, loom over the credibility of the secondary data. A recent development in defense of the stark decline—is the renewed commitment of the country in wake of the National Nutrition Mission (commenced 2017-18). This welcome move, aims at a 2% decline in the prevalence of undernutrition every year and is to function in a phased manner. Chandigarh, was considered in the first phase (2017-18) of this mission [25]. While it does seem plausible for administrative commitment to reflect in indicators, the other face of the coin may harbor misreporting. In case of the latter, supportive supervision may equally need strengthening. It should also be noted that besides the ICDS, a number of other direct (Mid-day Meal Scheme) and cross-cutting schemes (National Health Mission-RMNCH+A, Janani Suraksha Yojana, Targeted Public Distribution System, etc.) [9], may also affect the discourse of malnutrition; with more recent additions being the Swachh Bharat Abhiyan-2014 (aimed at sanitation) [9], and Prime Minister Ujjwala Yojana-2016 (provides clean cooking fuel to the poor).
Nevertheless, the question remains—is the decadal change in malnutrition a myth or reality? Perhaps we need further research to validate the reported findings.
Ethical Approvals
For collection of data in 2010, approvals of Institutional Ethics Committee of our institute were obtained.
Conflict of Interest
None declared
Acknowledgements
None
References
- World Health Organization. Malnutrition. [cited 2020 May 20]. Available from: https://www.who.int/health-topics/malnutrition.
- World Health Organization. UNICEF/WHO/The World Bank Group joint child malnutrition estimates: levels and trends in child malnutrition: key findings of the 2020 edition. [cited 2020 May 20]. Available from: https://www.who.int/publications-detail/jme-2020-edition.
- Black RE, Victora CG, Walker SP, Bhutta ZA, Christian P, De Onis M ,et al. Maternal and child undernutrition and overweight in low-income and middle-income countries. Lancet. 2013;382(9890):427-51. Available from: https://pubmed.ncbi.nlm.nih.gov/23746772/.
- International Institute for Population Sciences (IIPS) and ICF. National Family Health Survey (NFHS-4), 2015–16: India. Available from: http://rchiips.org/NFHS/NFHS-4Reports/India.pdf
- 2020 Global Nutrition Report: Action on equity to end malnutrition. Bristol, UK: Development Initiatives. [cited 2020 May 20]. Available from: https://globalnutritionreport.org/reports/2020-global-nutrition-report/.
- Ministry of Women and Child Development, GoI. Integrated Child Development Services (ICDS) Scheme. [cited 2020 Mar 20]. Available from: https://icds-wcd.nic.in/icds.aspx.
- UNICEF. India - Integrated Child Development Services (ICDS). [cited 2020 May 20]. Available from: www.unicef.org/earlychildhood/files/india_icds.pdf.
- Planning Commission. Evaluation report on integrated child development services. 2011. Available from: http://www.nipccd-earchive.wcd.nic.in/sites/default/files/PDF/Evaluation%20Study%20on%20ICDS.pdf.
- NITI Aayog. GoI. National Nutrition Strategy. New Delhi; 2017. [cited May 20, 2020]. Available from: https://niti.gov.in/writereaddata/files/document_publication/Nutrition_Strategy_Booklet.pdf.
- Social Welfare, Women & Child Development, Chandigarh Administration. ICDS (Integrated Child Development Scheme). [cited 2020 May 20]. Available from: http://chdsw.gov.in/?q=content/icds-integrated-child-development-scheme.
- Ministry of Women and Child Development, GoI. Integrated Child Development Services (ICDS) Scheme. Status report of the ICDS as per column (2). [cited 2020 Mar 20]. Available from: https://icds-wcd.nic.in/icds.aspx.
- Prinja S, Thakur JS, Bhatia SS. Pilot testing of WHO Child Growth Standards in Chandigarh: implications for India's child health programmes. B World Health Organn. 2009;87:116-22. Available from: https://www.who.int/bulletin/volumes/87/2/08-051789.pdf.
- Bolin JH, Edwards JM, Finch WH, Cassady JC. Applications of cluster analysis to the creation of perfectionism profiles: a comparison of two clustering approaches. Front Psychol. 2014;5:343. [doi:10.3389/fpsyg.2014.00343]
- Eddie S. Attribute based clustering plugin for QGIS short manual [Internet]. 2016. [cited 2020 Jun 2]. Available from: http://www.ekazakov.info/projects/abc_tutorial.html
- World Health Organization. Global Database on Child Growth and Malnutrition. [cited 2020 May 20]. Available from: https://www.who.int/nutgrowthdb/about/introduction/en/index2.html.
- Thakur JS, Prinja S, Bhatia SS. Persisting malnutrition in Chandigarh: decadal underweight trends and impact of ICDS program. Indian Pediatr. 2011;48(4):315-8. Available from: https://link.springer.com/article/10.1007/s13312-011-0058-1.
- Kumar D, Goel NK, Kalia M, Mahajan V. Socio-demographic Factors Affecting the Nutritional Status of the Under Three Children in Chandigarh, UT. Healthline, J Indian Assoc Prev Soc Med. 2015;6(1):46-52. Available from: http://www.iapsmgc.org/index_pdf/173.pdf.
- Striessnig E, Bora JK. Under-five child growth and nutrition status: spatial clustering of Indian districts. Spat Demogr. 2020:1-22. Available from: https://link.springer.com/article/10.1007/s40980-020-00058-3.
- Swaminathan A, Kim R, Xu Y, Blossom JC, Venkatraman R, Kumar A, et al. Burden of Child Malnutrition in India: A view from parliamentary constituencies. Econ Polit Wkly. 2019;54(2). Available from: https://cdn1.sph.harvard.edu/wp-content/uploads/sites/1266/1266/20/Burden-of-Child-Malnutrition-in-India.pdf.
- De Onis M, Onyango AW, Borghi E, Garza C, Yang H. Comparison of the World Health Organization (WHO) Child Growth Standards and the National Center for Health Statistics/WHO international growth reference: implications for child health programmes. Public Health Nutr. 2006t;9(7):942-7. Available from: https://www.who.int/childgrowth/publications/comparison_implications/en/.
- National Institute of Public Cooperation and Child Development. Growth Monitoring Manual. New Delhi. 2011. [cited 2020 May 20]. Available from: https://hetv.org/pdf/growth-monitoring-manual-india.pdf.
- Kishore K. Anganwadis yet to use new standards of nutrition to collect data. The Hindu [Internet]. 2014 Jan 30. [cited 2020 May 20]. Available from: https://www.thehindu.com/news/national/tamil-nadu/anganwadis-yet-to-use-new-standards-of-nutrition-to-collect-data/article5631636.ece.
- Bharti B, Shava U. Changing spectrum of malnutrition in urban cities. Indian Pediatr. 2011;48:910. Available from: http://medind.nic.in/ibv/t11/i11/ibvt11i11p910.pdf.
- Sahu SK, Kumar SG, Bhat BV, Premarajan KC, Sarkar S, Roy G, et al. Malnutrition among under-five children in India and strategies for control. J Nat Sc Biol Med. 2015;6(1):18-23. Available from: https://www.ncbi.nlm.nih.gov/pmc/articles/PMC4367032/.
- Department of Public Relations, Chandigarh Administration. National Nutrition Mission Master Training Workshop organized at Snehalaya Maloya, Chandigarh. Press Release. 2018 Mar. [cited 2020 Jun 02]. Available from:http://chdpr.gov.in/dashboard/sites/default/files/pr9760.pdf
Published
Article metrics
- Views
- 1,260
- Downloads
- 1,074
Based on this site's usage statistics.