Original Article Vol. 5 No. 2 (2021): International J Health Systems and Implementation Research
Temporal Analysis of Under 5 Mortality Rate at Sub-National Level in India
Under 5 Mortality Rate at Sub-National Level
Downloads
Topics
Keywords:
- Mortality rate, sub-national level, temporal analysis, under-five mortality,
Abstract
Background-Mortality is an essential indicator for constructing health policy and evaluating health systems. Death at an early age, specifically between 0 to 5 years, is a significant public health problem. Reducing infant and under-five deaths has been a prime concern across the developing nations but has tasted sporadic success. Thus, it becomes imperative to estimate these mortality rates to develop effective strategies and take appropriate actions to reduce the death numbers. Objectives- Examining growth rates of U5MR at sub national level and identifying the top 5 and bottom 5 performers in rural and urban India at the sub-national level. Methodology- Twenty Indian states for which the comparable data was available in public domain were included in the study. These states have been classified into four regions, i.e., the northern, southern, eastern, and western & central. The study examined Under-five Mortality Rates (U5MR) growth rates at the sub-national level. The top five and bottom five performers in rural and urban areas of twenty Indian states have also been identified using a semi-linear regression model. Results- The Eastern (53 ± 8.08) and Western & Central regions (53 ± 6.08) have higher mean values of mortality rates. Kerala reported the lowest mean mortality value for both rural (13 ± 0.83) and urban population (11 ± 1.05). The study documents Delhi (-13.32%) as the best performing state amongst the rural areas and Himachal Pradesh (-10.68%) among the Urban areas with respect to U5MR compound growth rates. Conclusion- Overall, the study shows that the twenty states included in the study have witnessed a reduction in U5MR growth rates. Results of the study can be utilized for a targeted approach by the respective state governments to monitor the U5MR in the selected Indian states to achieve the long-term targets of Sustainable Development Goals.
Full text
This web version was prepared from the published PDF, which is the version of record. Please cite and quote from the PDF.
Introduction
Mortality is an extremely important indicator for constructing health policy and evaluation of health systems of any state. As per the demographic transition theory, the countries globally had a higher death rate in the past as compared to the current population trend. Over the decades, with the advancement of science and technology and new innovations in health sector, the death rates have considerably declined [1]. This can be accompanied by the fact that the population of the world has also increased over centuries [2].
Death at an early age specifically between the ages of 0 to 5 years is one of the most significant medical issues worldwide [3]. Mortality or death rates of a state is influenced by multiple factors such as health systems, including state and private health expenditure, prevalence and incidence of various chronic diseases, and other socio-demographic characteristics [4].
To continuously reduce the death rates and provide a better environment for humans to live in, it is crucial to know the number of deaths happening around us to construct specific strategies and take appropriate actions to reduce the numbers [5]. For the same, mortality rate is a vital measure that reflects the population health status, and it permits us to compare the various population health components such as Health Systems and interventions [6,7]. One of the measures of mortality is Under Five Mortality Rate (U5MR). U5MR is the probability of dying before the age of five years. It is also included as one of the vital targets (Indicator number 3.2.1) of the Sustainable Development Goals (SDG) of the United Nations. In the Indian scenario, very few studies have been conducted specifically mapping the trend of U5MR and examining its growth rates at the sub-national level. Furthermore, as per the Indian constitution health is a state subject where in the State governments plan out and roll out strategies. Therefore, U5MR is a vital statistic which can help state governments to make strategic and specific plans to check the number of deaths in the age group of 0 to 5 years so as India as a country can move towards the trajectory of achieving the Sustainable Development Goals (SDG) related to U5MR.
For this study, specific objectives have been set:
- Examining growth rates of U5MR at sub national level
- Identifying the top 5 and bottom 5 performers in rural and urban India with respect to U5MR.
Methodology
- Study design – The current study is based on secondary data and involves a time series analysis of Indian states.
- Study population – The study population includes the twenty Indian states for which the comparable secondary data was available in public domain. The twenty states included in the study are divided into four regions; Northern, Southern, Eastern and Western & Central regions as per the guidelines of RBI [8]. The western and central regions have been compiled into one region so that the size of different regions remain comparable in order to facilitate the subsequent comparative analysis. The states included in the study are those for which the data was available in the public domain.
- Study data and sources – U5MR data was obtained from Sample Registration System (SRS) for the years starting from 2011 to 2017. The annual reports of Sample Registration System are published by the Office of the Registrar General & Census Commissioner, Ministry of Home Affairs, Government of India.
- Statistical analysis – The temporal compound annual growth rate (CAGR) were estimated using a semi log linear regression model [9,10]. Negative values of growth rates indicate better performance of the state since mortality is a negative indicator, whereas; a positive value indicates an increase in the U5MR rate. Graphical charts and other descriptive statistical measures, such as mean, standard deviation and coefficient of variation were also computed. Microsoft Excel, 2019, and SPSS version 25 were used for all the statistical analysis.
Findings
Descriptive Characteristics
The mean values of the states have been calculated from 2011 to 2017 along with coefficient of variation (CV) as depicted in Table 1
From Table 1 it can be observed that for rural areas, the mean U5MR value of Northern region (40) and Southern region (30) is less than that of national mean value (51). The best performing state with respect to rural region with the least mean value is Kerala (13). The lower value of Coefficient of variation (CV), indicates less fluctuations and better stability of the region or the state. The Southern region has a CV of 8.33% which is the least as compared to all the regions and lower than that of national CV (13.24%).
Likewise, in context to urban India, the Southern region (21) and Northern region (28) have lower mean values as compared to the national mean value (29). The state with lowest mean U5MR value is Kerala (11). The Eastern region (8.63%) and Southern (9.81%) have registered CV values lesser than that of the country as a whole (11.59%).
| Regions | Rural | Urban | ||
|---|---|---|---|---|
| Mean ± SD | CV | Mean ± SD | CV | |
| Northern Region | 40 ± 7.1 | 17.75% | 28 ± 3.69 | 13.18% |
| Delhi | 32 ± 8.81 | 27.53% | 23 ± 3.29 | 14.30% |
| Haryana | 46 ± 5.37 | 11.67% | 34 ± 4.98 | 14.65% |
| Himachal Pradesh | 36 ± 7.24 | 20.11% | 29 ± 6.32 | 21.79% |
| Jammu & Kashmir | 36 ± 8.47 | 23.53% | 26 ± 4.1 | 15.77% |
| Punjab | 32 ± 6.07 | 18.97% | 24 ± 2.44 | 10.17% |
| Rajasthan | 58 ± 7.83 | 13.50% | 32 ± 3.33 | 10.41% |
| Southern Region | 30 ± 2.5 | 8.33% | 21 ± 2.06 | 9.81% |
| Andhra Pradesh | 44 ± 3.37 | 7.66% | 29 ± 2.78 | 9.59% |
| Karnataka | 36 ± 4.06 | 11.28% | 27 ± 4.10 | 15.19% |
| Kerala | 13 ± 0.83 | 6.38% | 11 ± 1.05 | 9.55% |
| Tamil Nadu | 25 ± 2.13 | 8.52% | 18 ± 1.99 | 11.06% |
| Eastern Region | 53 ± 8.08 | 15.25% | 32 ± 2.76 | 8.63% |
| Assam | 69 ± 11.3 | 16.38% | 30 ± 6.23 | 20.77% |
| Bihar | 52 ± 6.73 | 12.94% | 39 ± 4.43 | 11.36% |
| Jharkhand | 46 ± 8.06 | 17.52% | 28 ± 2.66 | 9.50% |
| Odisha | 63 ± 9.5 | 15.08% | 39 ± 2.23 | 5.72% |
| West Bengal | 34 ± 5.08 | 14.94% | 26 ± 2.03 | 7.81% |
| Western & Central | 53 ± 6.08 | 11.47% | 33 ± 4.5 | 13.64% |
| Chhattisgarh | 54 ± 3.12 | 5.78% | 37 ± 4.4 | 11.89% |
| Gujrat | 50 ± 6.75 | 13.50% | 27 ± 5.07 | 18.78% |
| Madhya Pradesh | 71 ± 7.92 | 11.15% | 41 ± 5.5 | 13.41% |
| Maharashtra | 30 ± 2.92 | 9.73% | 17 ± 2.12 | 12.47% |
| Uttar Pradesh | 62 ± 10.26 | 16.55% | 43 ± 6.27 | 14.58% |
| India | 51 ± 6.75 | 13.24% | 29 ± 3.36 | 11.59% |
Trend growth rate for the Twenty Indian States from 2011 to 2017
The compound annual growth rates were calculated using the regression coefficients of the semi log regression model, where the U5MR values were regressed on time.
As indicated in Table 2, with respect to rural population, Delhi witnessed substantial reduction of U5MR growth rate (-13.32%), while Kerala registered the lowest reduction (-1.98%) in growth rates.
It was additionally observed that for the urban population, Himachal Pradesh (-10.68%) has the best reduction in U5MR growth rate, whereas Kerala (2.74%) is at the bottom has witnessed a positive growth. Overall, Jammu and Kashmir (-10.96%) emerged as top performer with the best reduction in compound growth rates of U5MR, whereas Kerala (-1.78%) is at the bottom of the table for the total population.
| State | Rural | Rank | Urban | Rank | Total | Rank |
|---|---|---|---|---|---|---|
| Andhra Pradesh | -3.73% | 18 | -4.50% | 12 | -3.82% | 18 |
| Assam | -8.06% | 6 | -9.88% | 2 | -8.06% | 4 |
| Bihar | -6.29% | 12 | -2.08% | 19 | -6.11% | 12 |
| Chhattisgarh | -2.57% | 19 | -5.26% | 10 | -3.15% | 19 |
| Delhi | -13.32% | 1 | -5.54% | 9 | -6.95% | 9 |
| Gujarat | -6.57% | 10 | -8.61% | 3 | -7.78% | 6 |
| Haryana | -5.45% | 13 | -6.29% | 7 | -5.92% | 13 |
| Himachal Pradesh | -9.70% | 3 | -10.68% | 1 | -10.06% | 2 |
| Jammu & Kashmir | -10.95% | 2 | -7.23% | 4 | -10.96% | 1 |
| Jharkhand | -8.42% | 5 | -2.76% | 17 | -8.33% | 3 |
| Karnataka | -5.35% | 14 | -6.67% | 6 | -5.82% | 14 |
| Kerala | -1.98% | 20 | 2.74% | 20 | -1.78% | 20 |
| Madhya Pradesh | -5.35% | 15 | -5.64% | 8 | -5.82% | 15 |
| Maharashtra | -4.69% | 16 | -4.88% | 11 | -5.26% | 16 |
| Odisha | -7.32% | 8 | -2.47% | 18 | -7.13% | 8 |
| Punjab | -8.52% | 4 | -4.30% | 14 | -7.60% | 7 |
| Rajasthan | -6.57% | 11 | -3.54% | 15 | -6.48% | 11 |
| Tamil Nadu | -4.02% | 17 | -4.40% | 13 | -4.97% | 17 |
| Uttar Pradesh | -7.96% | 7 | -6.76% | 5 | -8.06% | 5 |
| West Bengal | -7.13% | 9 | -3.15% | 16 | -6.85% | 10 |
Identification of Top 5 and Bottom 5 states in Rural and Urban Sector
As indicated in Table 3, Delhi, Jammu & Kashmir, Himachal Pradesh, Punjab and Jharkhand are the top 5 performing states in the rural sector; while Maharashtra, Tamil Nadu, Andhra Pradesh, Chhattisgarh and Kerala are the states at the bottom five positions. With respect to the urban population, Himachal Pradesh, Assam, Gujarat, Jammu & Kashmir and Uttar Pradesh are the top five states while, West Bengal, Jharkhand, Odisha, Bihar and Kerala are the bottom five states.
| Top 5 States (Rural) | Top 5 States (Urban) | ||||
|---|---|---|---|---|---|
| State | CAGR | Rank | State | CAGR | Rank |
| Delhi | -13.32% | 1 | Himachal Pradesh | -10.68% | 1 |
| Jammu & Kashmir | -10.95% | 2 | Assam | -9.88% | 2 |
| Himachal Pradesh | -9.70% | 3 | Gujarat | -8.61% | 3 |
| Punjab | -8.52% | 4 | Jammu & Kashmir | -7.23% | 4 |
| Jharkhand | -8.42% | 5 | Uttar Pradesh | -6.76% | 5 |
| Bottom 5 States (Rural) | Bottom 5 States (Urban) | ||||
| State | CAGR | Rank | State | CAGR | Rank |
| Maharashtra | -4.69% | 16 | West Bengal | -3.15% | 16 |
| Tamil Nadu | -4.02% | 17 | Jharkhand | -2.76% | 17 |
| Andhra Pradesh | -3.73% | 18 | Odisha | -2.47% | 18 |
| Chhattisgarh | -2.57% | 19 | Bihar | -2.08% | 19 |
| Kerala | -1.98% | 20 | Kerala | 2.74% | 20 |
Region wise Trend of U5MR for Rural and Urban sector
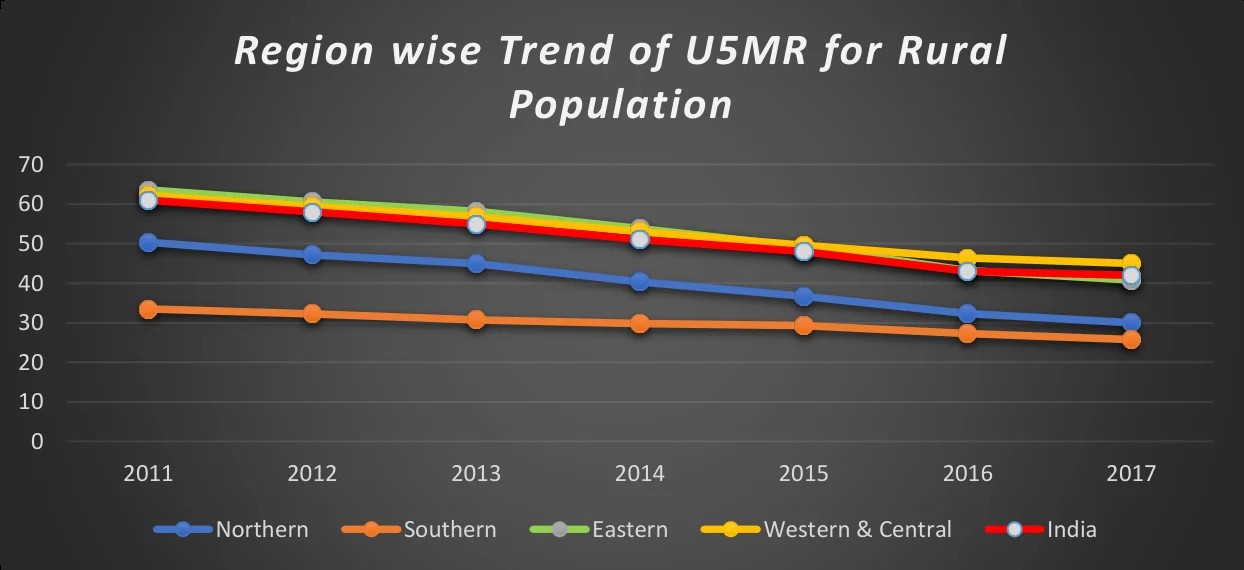
In the Graph 1, it can be seen that for the rural population, the U5MR values of the Eastern region was more than that of national values, however in 2017 , the U5MR value became less than that of national level. Only the Western & Central region consistently reported higher U5MR values than that of India from 2011 to 2017.
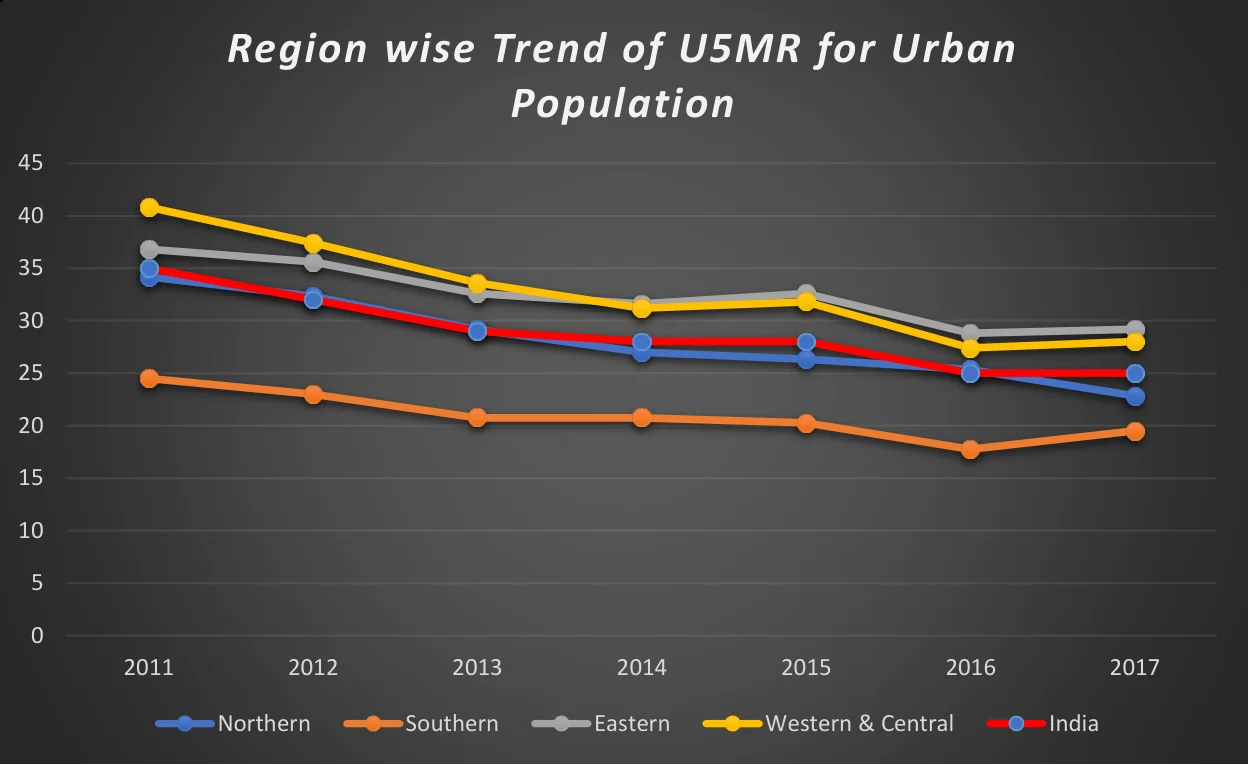
In Graph 2, it can be witnessed that for the urban population, the Northern region reported U5MR values very close to that of national level, whereas; the Southern region registered values less than that of national level. On the other hand, the Eastern and Western & Central regions have a higher U5MR in urban areas as compared to national level.
Discussion
Child mortality rate is a significant indicator for evaluating the health status and development level of any society [11]. In 1998, India recorded about 2.5 million under-5-year-old deaths, the highest number in any country. India included reducing the national mortality rate for children under five years of age to less than 100 per 1000 live births in the health goals for the year 2000 [12]. India is also one of the signatories to the United Nations Convention on the Rights of the Child (UNCRC), which advocates the healthy lives of children by addressing survival, nutrition, and other health care problems [13]. It is the foremost step to estimate the number of deaths and the trend of mortality rate to devise a robust strategy for reducing mortality. One such vital measure of mortality is U5MR, and the present study's objective was to study the growth rate of U5MR. A semi-log linear model was used to carry out the analysis.
The study estimated the growth rate for U5MR of twenty Indian states from 2011 to 2017 and calculated CAGR to identify the top and bottom five performing states. The mean mortality values of Eastern and Western & Central were higher than the other two regions for both rural and urban population. The factors responsible for higher mean mortality values in the eastern region could be low accessibility to health care services due to geographical constraints, economic backwardness, absence of quality education, and shortage of medical professionals [14]. The Western & Central region consists of larger and heavily populated states. The heavily populated states still require additional efforts in terms of efficient resource allocation and management to accelerate the mortality decline [15].
Based on the CAGR, the top five performing states in the rural sector show four states, i.e., Delhi, Jammu & Kashmir, Himachal Pradesh, and Punjab, from the northern region. It merely suggests a trend of the significant reduction in the mortality values of these states and does not mean that the mortality values of the states are low. The decline in mortality rates can be attributed to the rapid growth of healthcare delivery with the help of Auxiliary Nurse Midwife (ANM), Anganwadi workers (AWW), Accredited Social Health Activists (ASHAs) in the northern region [16].
The top five performing states in the urban sector are Himachal Pradesh, Assam, Gujarat, Jammu & Kashmir, and Uttar Pradesh. This depicts that the mortality values of these states have reduced over time which could be a result of biomedical and economic advancements [16]. Though it is seen that the southern states are not in the top five performing states, but most of these states have the lowest U5MR values. The study also displays the U5MR trend for urban and rural areas of the four regions through graphs. The trend line in the graph clearly shows that the U5MR values of the southern region are relatively lower than the national level. Kerala reported the lowest mean mortality value of 13 but is still at the bottom of the performance table. This can be explained by the fact that Kerala has already reached the saturation point of low mortality rates, and only minimal further reduction is possible [17].
Other states in the bottom five of the performance table include Maharashtra, Chhattisgarh in the rural sector and West Bengal, Jharkhand, Bihar, and Odisha in the urban sector. These states are larger and densely populated, resulting in resource constraints. This leads to low accessibility to health services, poor infrastructure, inadequate health care delivery services, and a shortage of medical staff [12, 15]. Another study based on NFHS data [18] states that Maharashtra and West Bengal are poor-performing states regarding child mortality.
Overall, it can be seen that the twenty states included in the study have witnessed a reduction in U5MR rates over the years, which is synonymous with results shown by various studies [12,18,19]. The states in the Eastern region have the highest U5MR rates, which is also reflected in a study conducted by Claeson et al. [12]. Higher U5MR rates in the eastern area could be due to factors like access to health care services in the rural parts due to terrain [20]. The southern region shows the best results in urban and rural sectors as the states' actual values are much lower than other Indian states [12]. It could be because literacy rates in the southern region are high compared to other states, and a strong positive correlation has been seen between U5MR rates and the education level of mothers [21].
There are several policy suggestions offered by the present study. Despite the significant decline in the under-five mortality rates in the last few years, more efforts are still required. The study identifies the top five and bottom five performing states in rural and urban areas. The policymakers should focus on the poor-performing states, which are persistent outliers in the mortality values. The policymakers must also target larger states with the highest population having the maximum potential to reduce under-five mortality values significantly [15].
The limitation of the present study is that all the Indian states could not be covered as data for U5MR was not available for each state. However, it is based on the data obtained from authentic government sources. The methodology adopted in the present study can be utilized for a targeted approach by the respective state governments to monitor the U5MR in the selected Indian states to achieve the long-term targets of Sustainable Development Goals. Furthermore, using this methodology, other mortality indicators could also be studied.
Ethical Approvals
The study involves secondary data analysis based on data freely available in public domain. The study does not involve the collection of primary data and therefore did not require interactions in any form with the participants/human subjects. The study draws upon some portion of the findings of the dissertation work done by Dr. Ankit Bahl during Masters in Public Health, the approvals of which had already been obtained by the institutional ethics committee vide letter INT/IEC/2020/SPH-1079 in the year 2020.
Conflict of Interest
No conflict of interest exists among the authors
Acknowledgement
None
References
- Delany I, Rappuoli R, De Gregorio E. Vaccines for the 21st century. EMBO molecular medicine. 2014 Jun;6(6):708-20. [doi:10.1002/emmm.201403876]
- Davis K. The world demographic transition. The Annals of the American Academy of Political and Social Science. 1945 Jan;237(1):1-1. [doi:10.1177/000271624523700102]
- WHO. 2018 Global Reference List of 100 Core Health Indicators (plus Health-Related SDGs).; 2018. https://www.who.int/healthinfo/indicators/2018/en/
- Porta M. Mortality Rate, Morbidity rate; Death rate; Cumulative death rate; Case fatality rate. In: Porta M, ed. A Dictionary of Epidemiology. 6th ed. Oxford University Press; 2014:189, 69, 64, 36. [Google Scholar]
- Ezzati M, Lopez AD, Rodgers A, Vander Hoorn S, Murray CJL. Selected major risk factors and global and regional burden of disease. Lancet. 2002;360(9343):1347-1360. doi:10.1016/S0140-6736(02)11403-6
- Liu L, Chu Y, Oza S, et al. National, regional, and state-level all-cause and cause-specific under-5 mortality in India in 2000–15: a systematic analysis with implications for the Sustainable Development Goals. Lancet Glob Heal. 2019;7(6):e721-e734. doi:10.1016/S2214-109X(19)30080-4
- Fawole AO, Shah A, Fabanwo AO, et al. Predictors of maternal mortality in institutional deliveries in Nigeria. Afr Health Sci. 2012;12(1):32-40 [Google Scholar]
- RBI. Handbook of Statisticts on Indian States, 2016-2017 [Google Scholar]
- Gujarati DN, Porter DC. Basic Econometrics. Fifth Edit.; 2009 [Google Scholar]
- Greene WH. Econometric analysis. Pearson Education India; 5thed. New York. 2003. [Google Scholar]
- Stockwell EG, Swanson DA, Wicks JW. Economic status differences in infant mortality by cause of death. Public Health Rep 1988; 103:135-42. [Google Scholar]
- Claeson M, Bos ER, Mawji T, Pathmanathan I. Reducing child mortality in India in the new millennium. Bulletin of the World Health Organization. 2000;78:1192-9. [Google Scholar]
- Srivastava RN. Right to Health for Children. Indian Pediatrics. 2015 Jan 15; 52:15-18. [doi:10.1007/s13312-015-0559-4]
- Prakash A, Saxena A. Health in north-east region of India – The new focus of attention. Indian Journal of Medical Specialties. July 2016; 7(3):93-94. DOI:10.1016/j.injms.2016.09.013
- Bhatia M, Dwivedi LK, Ranjan M, Dixit P, Putcha V. Trends, patterns and predictive factors of infant and child mortality in well-performing and underperforming states of India: a secondary analysis using National Family Health Surveys. BMJ open. 2019 Mar 1;9(3):e023875. [doi:10.1136/bmjopen-2018-023875]
- Srinivisan R. Healthcare in India-Vision 2020: issues and prospects- https://niti.gov.in/planningcommission.gov.in/docs/reports/genrep/bkpap2020/26_bg2020.pdf
- Dhirar N, Dudeja S, Khandekar J, Bachani D. Childhood Morbidity and Mortality in India—Analysis of National Family Health Survey 4 (NFHS-4) Findings. Indian pediatrics. 2018 Apr 1;55(4). [Google Scholar]
- Bhatia M, Ranjan M, Dixit P, Dwivedi LK. Mind the gap: temporal trends in inequalities in infant and child mortality in India (1992–2016). SSM-population health. 2018 Aug;5:201. [doi:10.1016/j.ssmph.2018.05.001]
- Kumar P, Singhal N. Mapping neonatal and under-5 mortality in India. The Lancet. 2020 May 23;395(10237):1591-3. [doi:10.1016/s0140-6736(20)31050-3]
- Kumar C, Singh PK, Rai RK. Under-five mortality in high focus states in India: a district level geospatial analysis. Plos one. 2012 May 18;7(5):e37515. [doi:10.1371/journal.pone.0037515]
- Singh A, Pathak PK, Chauhan RK, Pan W. Infant and child mortality in India in the last two decades: a geospatial analysis. Plos one. 2011 Nov 2;6(11):e26856. [doi:10.1371/journal.pone.0026856]

Published
Article metrics
- Views
- 987
- Downloads
- 637
Based on this site's usage statistics.