Original Article Vol. 7 No. 2 (2023): International J Health Systems and Implementation Research
Afferent Turnaround Time for Larger and Smaller Indian States during COVID Lockdown
Afferent Turnaround Time during COVID Lockdown
Downloads
Topics
Keywords:
- COVID-19
- Lockdown
- Afferent Turnaround Time
- Regional Variations
Abstract
Timely esting and diagnosis of Coronavirus disease (COVID-19) are critical for containing viral transmission. Afferent turnaround time (ATAT) from sample collection to result receipt directly impacts testing efficacy. There is limited understanding of ATAT dynamics across Indian states during lockdowns. The main objective of the study is to analyze ATAT for smaller and larger states and Union Territories of India during the COVID-19 lockdown. Secondary data analysis of the Indian Council of Medical Research (ICMR) national COVID-19 testing database from March 25 to May 31, 2020 was done. Descriptive statistics were used to calculate mean and standard deviation ATATs for larger states, smaller states, and Union Territories across four lockdown phases. Results: Stark ATAT differences observed between states of Jharkhand, Assam and Odisha exhibited prolonged times (53.7±24.57 hrs., 50.57±24.95 hrs., 50.1±21.26 hrs.) while Gujarat, Tamil Nadu and Telangana demonstrated shortest times (21.78±14.86 hrs., 23.4±16.72 hrs., 25.95±14.04 hrs.). Smaller states and Union Territories followed similar patterns. Regional disparities highlight varied testing infrastructure and logistics. Significant ATAT variations between Indian states during lockdowns underscore the need for targeted strategies to optimize processes and allocate resources. Findings offer insights to boost pandemic preparedness.
Full text
This web version was prepared from the published PDF, which is the version of record. Please cite and quote from the PDF.
Introduction
The COVID-19 pandemic has posed a formidable global public health challenge in the 21st century. Diagnostic tests have been instrumental in controlling the outbreak, serving crucial roles in screening, surveillance, and the prompt identification of new variants. This testing framework remains pivotal even with vaccination, enabling the rapid isolation of individuals and reducing the risk of further transmission . However, delays in developing and disseminating COVID-19 diagnostic tests have hindered effective public health management, impacted early viral transmission mapping, and strained personal protective equipment availability worldwide .Additionally, scheduling tests, particularly RT-PCR tests, have become a significant concern for epidemiological monitoring. The timing of tests is crucial, as untimely testing diminishes the impact on individual diagnosis and broader surveillance efforts. Turnaround time, distinguishing between 'Afferent Turnaround Time (ATAT)' and 'Laboratory Turnaround Time (LTAT),' directly influences diagnostic delays by measuring the duration from sample collection to result in receipt. Prolonged turnaround times contribute to treatment delays and an increased risk of disease transmission. Challenges in sample transportation and handling large volumes at laboratories further complicate early confirmation of COVID-19 cases, impacting the identification and isolation of case contacts .Given limited national-level studies, there is an imperative need for sub-national temporal analyses, particularly in the Indian context, across different waves of the pandemic.
A critical examination of existing literature reveals a notable gap in understanding ATAT variations between larger and smaller Indian states during the COVID-19 lockdown. While studies have explored the overall impact of COVID-19 and related lockdown phases on various socioeconomic aspects in India '—, there needs to be more specific investigations into the differences in ATAT across states of varying sizes. The available literature primarily focuses on broad aspects such as infection rates , effects on vulnerable populations '–, and socioeconomic disparities – but needs to delve into the nuances of ATAT, a critical metric for timely diagnostic results. Addressing this gap is crucial for developing targeted strategies to optimize testing procedures and healthcare resource allocation in larger and smaller Indian states during pandemic-induced lockdowns.
By focusing on ATAT, this study seeks to uncover patterns that may affectpolicy-making, resource allocation, and crisis management strategies. Concentrating on larger and smaller states ensures a nuanced understanding of the variations in ATATs, allowing for targeted recommendations to enhance testing strategies in diverse state contexts. Through this research, we endeavor to enrich the knowledge of the impact of lockdown measures on a crucial component of the COVID-19 testing process, with implications for future pandemic preparedness and response strategies.
Methodology
The present study employs an observational study design, focusing on secondary data analysis at the sub-national level using the Indian Council of Medical Research (ICMR) National COVID-19 testing database. This centralized repository houses extensive information encompassing patient demographic details, primary clinical data, and testing specifics for individuals tested for COVID-19 nationwide. Access to the ICMR database was granted through user credentials provided by the BMI division of ICMR, New Delhi, with meticulous measures taken to ensure data anonymity.
This study included all the COVID-19 tests conducted between March 25, 2020, and May 31, 2020. The data for the COVID-19 tests were extracted from the ICMR COVID-19 database and processed daily as per the date the COVID-19 sample was collected
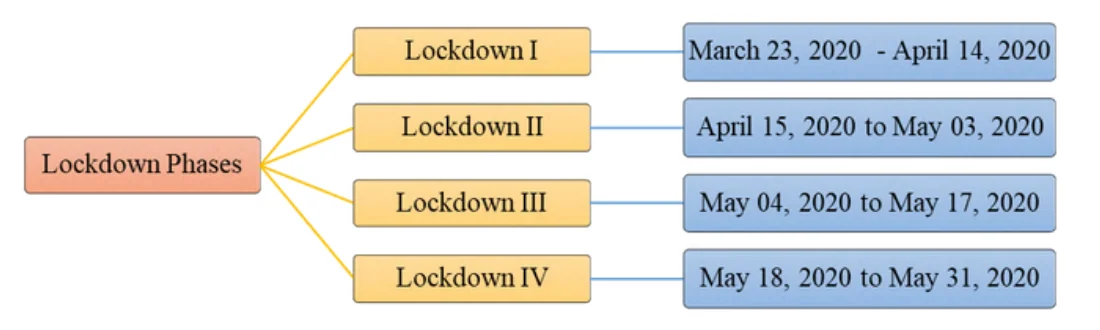
We divided the Lockdown period into different phases as depicted in the figure 1.
Data was analyzed using Stata 17 software along with the multiple packages in R software such as dplyr, tidyverse, and tidyr, etc. Missing values have been addressed using the complete case analysis (CCA) method. The CCA is a method for dealing with missing data in which all cases with missing values are dropped from the study . This means that only patients with complete data are used for analysis. It is a widely used method for addressing missing data, especially with a large dataset.
States have been categorized into Large and smallstates and Union Territories based onthe NITI Aayog Health Index Report . Categorization of States are given in table 1.
| Category | States |
|---|---|
| Larger States | Andhra Pradesh, Assam, Bihar, Chhattisgarh, Gujarat, Haryana, Himachal Pradesh, Jharkhand, Karnataka, Kerala, Madhya Prad esh, Maharashtra, Odisha, Punjab, Rajasthan, Tamil Nadu, Telangana, Uttar Pradesh, Uttarakhand |
| Smaller States | Arunachal Pradesh, Goa, Manipur, Meghalaya, Mizoram, Nagaland, Sikkim, Tripura |
| Union Territories | Andaman & Nicobar, Chandigarh, Dadra & Nagar Ha veli and Daman & Diu (DH & DD), Delhi, Jammu & Kashmir, Lakshadweep, Puducherry |
The study calculated Afferent turnaround time (ATAT) at the sub-national level in India. ATATsdenote the period from sample collection to sample testing'——'– .
Results
This study presents a meticulous analysis of ATATs for COVID-19 testing in central Indian states, as documented by NITI Aayog. Table 2 represents encapsulates data concerning ATATs for COVID-19 testing across largerstates, smaller states, and Union Territoriesof India during the four distinct lockdown intervals in 2020.ATAT, elucidating the interval from sample collection to result reception, is delineated through mean and standard deviation values. This research provides valuable insights into the nuanced temporal and regional dynamics of COVID-19 testing turnaround times during the exigent period of 2020.
In the Larger states, as shown in table2during Lockdown 1, Jharkhand, Madhya Pradesh, and Andhra Pradesh exhibited the highest turnaround times (74.82 ± 25.9, 59.7 ± 34.21, and 58.95 ± 31.73 days, respectively), contrasting with Gujarat, Himachal Pradesh, and Telangana, which displayed the lowest times (15.37 ± 15.78, 27.91 ± 9.41, and 32.41 ± 14.8 days, respectively). Lockdown 2 highlighted elevated turnaround times in Jharkhand, Madhya Pradesh, and Odisha (49.6 ± 16.97, 46.05 ± 18.19, and 45.04 ± 18.4 days, respectively), juxtaposed against Tamil Nadu, Himachal Pradesh, and Gujarat, which reported the lowest times (24.67 ± 14.12, 26.83 ± 8.17, and 27.59 ± 11.53 days, respectively). During Lockdown 3, Jharkhand, Odisha, and West Bengal reported the highest turnaround times (51.84 ± 20.29, 49.52 ± 17.42, and 42.5 ± 19.53 days, respectively). In comparison, Gujarat demonstrated the lowestturnaround times (20.4 ± 12.32 days). In Lockdown 4, Jharkhand, Assam, and Chhattisgarh recorded the highest Mean and Standard Deviation (54.9 ± 29.59, 54.19 ± 26.16, and 53.31 ± 24.53 days, respectively), whereas Tamil Nadu, Telangana, and Gujarat displayed the lowest (19.47 ± 15.32, 19.53 ± 12.96, and 21.87 ± 16.05 days, respectively). Across the entire lockdown duration, Jharkhand, Assam, and Odisha consistently reported elevated ATATs (53.7 ± 24.57, 50.57 ± 24.95, and 50.1 ± 21.26 days, respectively), while Gujarat, Tamil Nadu, and Telangana consistently reported the lowest (21.78 ± 14.86, 23.4 ± 16.72, and 25.95 ± 14.04 days, respectively).
In the smaller states, during Lockdown 1, Sikkim reported the highest turnaround time at 66.13 ± 36.6 days, followed by Goa at 44.9 ± 21.87 days, while Tripura showcased the lowest at 10.61 ± 14.65 days, followed by Meghalaya at 29.23 ± 9.93 days. During Lockdown 2, Mizoram recorded the highest turnaround time (43.38 ± 9.64 days), followed by Tripura (33.19 ± 14.3 days), while Sikkim and Manipur displayed the lowest times at 24 ± 0 days and 24.56 ± 3.65 days, respectively. In Lockdown 3, Nagaland reported the highest mean and standard deviation of turnaround time (31.83 ± 13.53 days), followed by Mizoram (31.79 ± 12.18 days), while Goa demonstrated the lowest (8 ± 9.66 days), followed by Manipur (26.06 ± 8.22 days). For Lockdown 4, Goa and Tripura exhibited the highest Mean and Standard Deviation of turnaround time (10.63 ± 10.64 days and 28 ± 12.54 days, respectively), while Manipur and Nagaland reported the lowest (74.54 ± 27.67 days and 69.12 ± 31.58 days, respectively). Throughout the lockdown period, Manipur, Nagaland, and Sikkim consistently reported the highest ATATs, averaging 67.13 ± 31.08 days, 58.29 ± 32.91 days, and 41.31 ± 25.8 days, respectively. In contrast, Goa, Tripura, and Meghalaya consistently reported the lowest times, averaging 11.46 ± 12.09 days, 28.25 ± 12.35 days, and 28.93 ± 11.98 days, respectively. (as shown in table 2)
In the Union Territories, as depicted in table 2 during Lockdown 1, Ladakh reported the highest turnaround time at 63.33 ± 14.38 days, closely followed by Puducherry at 59.1 ± 43.1 days, while data for Daman and Diu and Lakshadweep were unavailable. In Lockdown 2, Ladakh maintained the highest turnaround time (57.16 ± 17.7), followed by Daman and Diu (56.44 ± 17.39), with Andaman and Nicobar Islands and Lakshadweep exhibiting the lowest turnaround times at 23.69 ± 5.54 and 24.05 ± 1.11 days, respectively. Transitioning to Lockdown 3, Ladakh again reported the highest mean and standard deviation at 55.84 ± 14.5 days, with Daman and Diu at 39.51 ± 24.43 days, while Lakshadweep demonstrated the lowest mean and standard deviation at 12.86 ± 5.94 days, followed closely by Dadra and Nagar Haveli at 13.61 ± 9.87 days. Lockdown 4 showcased Ladakh and Jammu and Kashmir with the highest mean and standard deviation (77.54 ± 19.3 and 37.75 ± 21.4, respectively), whereas Dadra and Nagar Haveli and Lakshadweep exhibited the lowest (7.25 ± 5.5 and 10.37 ± 6.15, respectively). Throughout the entire lockdown period, Ladakh and Jammu and Kashmir consistently reported the highest ATAT, averaging 69.54 ± 20.41 and 33.77 ± 19.6 days, respectively, while Chandigarh and Andaman and Nicobar Islands consistently reported the lowest turnaround times, averaging 17.38 ± 10.8 and 19.52 ± 9.15 days, respectively.
| State of Residence/UTs | Lockdown-1 | Lockdown-2 | Lockdown-3 | Lockdown-4 | Total Lockdown period | |||||
|---|---|---|---|---|---|---|---|---|---|---|
| Mean (SD) | Median | Mean (SD) | Median | Mean (SD) | Median | Mean (SD) | Median | Mean (SD) | Median | |
| Larger States | ||||||||||
| Andhra Pradesh | 58.95 ± 31.73 | 48 | 37.13 ± 17.49 | 24 | 32.52 ± 18.02 | 24 | 37.16 ± 27.01 | 28.33 | 36.67 ± 23.65 | 25.75 |
| Assam | 39.46 ± 26.49 | 24 | 41.24 ± 18.98 | 48 | 41.15 ± 17.73 | 43.66 | 54.19 ± 26.16 | 49.53 | 50.57 ± 24.95 | 48 |
| Bihar | 37.09 ± 23.24 | 24 | 38.91 ± 16.62 | 31 | 31.51 ± 13.48 | 24 | 34.13 ± 19.16 | 28 | 34.54 ± 17.76 | 26.08 |
| Chhattisgarh | 35.83 ± 17.42 | 24 | 40.82 ± 17.52 | 48 | 33.51 ± 15.84 | 27.75 | 53.31 ± 24.53 | 51.28 | 44.73 ± 22.74 | 47.17 |
| Gujarat | 15.37 ± 15.78 | 24 | 27.59 ± 11.53 | 24 | 20.4 ± 12.32 | 24 | 21.87 ± 16.05 | 21.22 | 21.78 ± 14.86 | 24 |
| Haryana | 37.81 ± 19.39 | 24 | 31.83 ± 13.07 | 24 | 36.25 ± 19.44 | 25 | 28.65 ± 16.84 | 25.82 | 32.11 ± 17.59 | 24 |
| Himachal Pradesh | 27.91 ± 9.41 | 24 | 26.83 ± 8.17 | 24 | 28.66 ± 8.85 | 27.96 | 29.68 ± 13.11 | 29.89 | 29.37 ± 12.26 | 29.02 |
| Jharkhand | 74.82 ± 25.9 | 72 | 49.6 ± 16.97 | 48 | 51.84 ± 20.29 | 49.08 | 54.9 ± 29.59 | 52.95 | 53.7 ± 24.57 | 50 |
| Karnataka | 38.86 ± 16.81 | 48 | 37.77 ± 16.68 | 24 | 38.99 ± 18.79 | 30.31 | 47.42 ± 28.15 | 45.4 | 43.68 ± 24.77 | 44.19 |
| Kerala | 35.53 ± 17.17 | 24 | 31.64 ± 12.23 | 24 | 26.31 ± 11.12 | 24.58 | 25.14 ± 14.92 | 24 | 26.94 ± 14.59 | 24 |
| Madhya Pradesh | 59.7 ± 34.21 | 48 | 46.05 ± 18.19 | 48 | 39.7 ± 17.02 | 40.5 | 32.88 ± 15.93 | 29.21 | 39.27 ± 20.09 | 33.86 |
| Maharashtra | 39.74 ± 25.82 | 24 | 30.64 ± 13.38 | 24 | 31.47 ± 16.79 | 24 | 27.01 ± 20.21 | 24 | 29.65 ± 18.89 | 24 |
| Odisha | 56.49 ± 28.92 | 48 | 45.04 ± 18.4 | 48 | 49.52 ± 17.42 | 48 | 52.81 ± 24.33 | 51 | 50.1 ± 21.26 | 48 |
| Punjab | 49.25 ± 25.62 | 48 | 44.16 ± 17.94 | 48 | 34.27 ± 15.9 | 24 | 28.17 ± 12.43 | 24.59 | 32.08 ± 15.61 | 24.97 |
| Rajasthan | 52.52 ± 34.03 | 48 | 31.6 ± 14.92 | 24 | 27.21 ± 14.44 | 24 | 31.27 ± 20.87 | 24.95 | 31.09 ± 19.88 | 24 |
| Tamil Nadu | 41.95 ± 30.49 | 24 | 24.67 ± 14.12 | 24 | 24.82 ± 15.43 | 24 | 19.47 ± 15.32 | 16.5 | 23.4 ± 16.72 | 24 |
| Telangana | 32.41 ± 14.8 | 24 | 29.31 ± 12.17 | 24 | 22.67 ± 9.94 | 24 | 19.53 ± 12.96 | 19.9 | 25.95 ± 14.04 | 24 |
| Uttar Pradesh | 52.66 ± 31.77 | 48 | 37.95 ± 16.84 | 24 | 37.59 ± 17.98 | 30.83 | 36.53 ± 19.67 | 30.5 | 37.88 ± 19.67 | 30.5 |
| Uttarakhand | 44.33 ± 19.67 | 48 | 36.23 ± 16.29 | 24 | 29.87 ± 17.5 | 24 | 50.06 ± 30.73 | 44.95 | 44.24 ± 27.86 | 34.78 |
| West Bengal | 36.55 ± 21.01 | 24 | 36.47 ± 16.55 | 24 | 42.5 ± 19.53 | 46.31 | 52.06 ± 29.59 | 49.01 | 46.69 ± 25.59 | 47.87 |
| Smaller States | ||||||||||
| Goa | 44.9 ± 21.87 | 48 | 29.3 ± 12.01 | 24 | 8 ± 9.66 | 4.5 | 10.63 ± 10.64 | 5.91 | 11.46 ± 12.09 | 6.02 |
| Manipur | 39.62 ± 37.5 | 24 | 24.56 ± 3.65 | 24 | 26.06 ± 8.22 | 24 | 74.54 ± 27.67 | 86.31 | 67.13 ± 31.08 | 74.96 |
| Meghalaya | 29.23 ± 9.93 | 24 | 30.02 ± 10.88 | 24 | 27.16 ± 10.45 | 24 | 29.08 ± 12.49 | 27.37 | 28.93 ± 11.98 | 24.66 |
| Mizoram | 44.3 ± 21.56 | 48 | 43.38 ± 9.64 | 48 | 31.79 ± 12.18 | 24.75 | 33.63 ± 26.49 | 22.51 | 34.49 ± 25.57 | 22.9 |
| Nagaland | 30.62 ± 15.57 | 24 | 26.03 ± 7.55 | 24 | 31.83 ± 13.53 | 24 | 69.12 ± 31.58 | 80.16 | 58.29 ± 32.91 | 53.91 |
| Sikkim | 66.13 ± 36.6 | 63.63 | 24 ± 0 | 24 | 27.82 ± 13.63 | 25 | 46.99 ± 27.53 | 44.89 | 41.31 ± 25.8 | 32.33 |
| Tripura | 10.61 ± 14.65 | 0.166 | 33.19 ± 14.3 | 24 | 26.36 ± 9.04 | 24 | 28 ± 12.54 | 27 | 28.25 ± 12.35 | 25.08 |
| Union Territories | ||||||||||
| Andaman and Nicobar Islands | 23.85 ± 8.48 | 24 | 23.69 ± 5.54 | 24 | 20.19 ± 8.24 | 24 | 12 ± 10.04 | 7.11 | 19.52 ± 9.15 | 24 |
| Chandigarh | 26.46 ± 7.37 | 24 | 26.52 ± 8.83 | 24 | 20.4 ± 10.5 | 24 | 14.48 ± 9.95 | 12.71 | 17.38 ± 10.8 | 18.25 |
| Dadra and Nagar Haveli | 38.44 ± 19.25 | 24 | 50.04 ± 19.11 | 48 | 13.61 ± 9.87 | 9.87 | 7.25 ± 5.5 | 5.26 | 25.41 ± 24.36 | 19 |
| Daman and Diu | NA | NA | 56.44 ± 17.39 | 60 | 39.51 ± 24.43 | 46.95 | 18.48 ± 20 | 8.61 | 32.85 ± 26.21 | 24 |
| Delhi | 39.1 ± 30.02 | 24 | 33.61 ± 15.9 | 24 | 29.94 ± 16.19 | 24 | 27.02 ± 20.29 | 23.76 | 29.63 ± 19.5 | 24 |
| Jammu and Kashmir | 37.86 ± 29.73 | 24 | 28.18 ± 16.19 | 24 | 30.96 ± 16.81 | 24 | 37.75 ± 21.4 | 29.16 | 33.77 ± 19.6 | 25 |
| Ladakh | 63.33 ± 14.38 | 72 | 57.16 ± 17.7 | 72 | 55.84 ± 14.5 | 48 | 77.54 ± 19.3 | 74.67 | 69.54 ± 20.41 | 72 |
| Lakshadweep | NA | NA | 24.05 ± 1.11 | 24 | 12.86 ± 5.94 | 10 | 10.37 ± 6.15 | 9.08 | 20.38 ± 6.85 | 24 |
| Puducherry | 59.1 ± 43.1 | 48 | 24.86 ± 5.31 | 24 | 25.87 ± 10.37 | 24 | 18.55 ± 16.74 | 18.91 | 27.51 ± 24.5 | 24 |
Discussion
The pandemic has caused a delay in healthcare provision in patients suffering from non-COVID-related illnesses, but uncertainties in patients with COVID-19 symptoms have not been thoroughly described. Delays at each time point might be corrected or improved with specific strategies to optimize the use of SARS-CoV-2 screening test results for clinical case identification and isolation during the estimated period of infectiousness. We used this framework to describe the time between the onset of symptoms, testing, sample processing, and test results report for SARS-CoV-2 . In this study, we analyzed COVID-19 data to understand the ATAT for COVID-19 testing across India during the four lockdown periods in 2020. The data about ATATs for COVID-19 testing during the four lockdown periods are classified and presented for larger Indian states, smaller Indian states, and Union territories. There are a few other works that are based explicitly on Indian COVID-19 data, but this is the first and only study that has been done about the ATATs for COVID-19 testing across India to date.
The comprehensive analysis of afferent turnaround times for COVID-19 testing during the distinct lockdown periods of 2020 in major Indian states and smaller states, as well as in the Union Territories, as documented by NITI Aayog, reveals intriguing temporal and regional dynamics. The results exhibit stark differences in the turnaround times across different states and Union Territories, indicating the presence of varied testing infrastructures, logistical capacities, and operational efficiencies. States such as Jharkhand, Madhya Pradesh, and Odisha consistently reported elevated turnaround times, highlighting potential infrastructural or logistical challenges in these regions. In contrast, Gujarat, Tamil Nadu, and Telangana always displayed lower turnaround times, demonstrating the fastest turnaround times throughout the lockdowns, possibly due to factors like well-developed testing infrastructure and efficient logistics. Similarly, Union Territories like Ladakh consistently reported higher turnaround times than Chandigarh, Andamanand Nicobar Islands. These differences can be ascribed to a range of factors, such as the presence and ease of access to testing facilities, transportation options, logistical infrastructure, administrative and regulatory procedures, and the overall healthcare and public health capabilities within each specific region. Additionally, socioeconomic, demographic, and geographic disparities may have influenced the efficacy and efficiency of COVID-19 testing processes and subsequent turnaround times. These observations indicate temporal discrepancies and provide essential insights for policymakers and healthcare administrators actively involved in pandemic response initiatives.
The findings highlight substantial variations in turnaround times across different regions, underscoring the need for a nuanced understanding of the factors influencing testing efficiency and capacity. The disparities in turnaround times observed could be attributed to diverse factors such as infrastructure, healthcare resources, administrative efficacy, and logistical challenges. These findings provide a nuanced understanding of the multifaceted landscape of COVID-19 testing operations in India during the challenging period of 2020, offering valuable insights for policymakers, healthcare stakeholders, and researchers. However, to comprehensively address the intricacies and implications of the observed turnaround time differentials, further research and in-depth analyses are warranted to uncover the underlying determinants and aid in crafting evidence-based strategies for optimizing testing processes and enhancing public health responses.
This study's strength lies in its comprehensive analysis of ATATs in larger and smaller Indian states during the COVID-19 lockdown, offering a nuanced understanding of how state size influences healthcare efficiency. Including both large and small states allows for a robust comparison supported by quantitative and qualitative methodologies, combining data analytics and stakeholder interviews. However, limitations include potential data accuracy issues and the influence of regional variations in healthcare infrastructure and reporting practices on the study's generalizability. Despite these constraints, the research provides valuable insights for policymakers and healthcare practitioners to enhance system responsiveness during crises.
Conclusion
To synthesize our exploration of ATATs for COVID-19 testing across larger and smaller Indian states during the 2020 lockdowns, we have unveiled significant regional variations and operational challenges. Larger states such as Jharkhand, Madhya Pradesh, and Odisha consistently reported prolonged turnaround times, indicating potential hurdles that necessitate focused interventions. In contrast, smaller states like Gujarat, Himachal Pradesh, and Telangana showcased commendable efficiency in their testing processes, underscoring the importance of tailoring strategies to the distinctive characteristics of each region.
These findings signify temporal disparities and offer pivotal insights for policymakers and healthcare administrators engaged in pandemic response efforts. The observed differences underscore the imperative of bolstering testing infrastructure, optimizing processes, and judiciously allocating resources based on regional dynamics. As we navigate the ongoing challenges posed by the COVID-19 pandemic and prepare for potential future health crises, the knowledge gleaned from this research can guide the development of targeted and effective strategies for expeditious and reliable COVID-19 testing, contributing to the establishment of robust and adaptive healthcare systems capable of addressing the demands of large-scale public health emergencies.
Ethical Approval
The study has been approved by the Institutional Ethics Committee of PGIMER, Chandigarh (PGI/IEC/2022/SPL-642 and IEC-03/2022-2350).
Conflict of Interest
The authors have no conflicts of interest to declare.
Source of funding
This research is part of a project sponsored bythe Indian Council of Medical Research, New Delhi, India.
References
- Wells CR, Pandey A, Moghadas SM, Singer BH, Krieger G, Heron RJL, et al. Comparative analyses of eighteen rapid antigen tests and RT-PCR for COVID-19 quarantine and surveillance-based isolation. Commun Med. 2022;2:84. [doi:10.1038/s43856-022-00147-y]
- Rapid Implementation of a SARS-CoV-2 Diagnostic Quantitative Real-Time PCR Test with Emergency Use Authorization at a Large Academic Safety Net Hospital - PubMed [Internet]. [cited 2023 Dec 15]. Available from: https://pubmed.ncbi.nlm.nih.gov/32838351/
- Núñez I, Belaunzarán-Zamudio PF, Caro-Vega Y. Result Turnaround Time of RT-PCR for SARS-CoV-2 is the Main Cause of COVID-19 Diagnostic Delay: A Country-Wide Observational Study of Mexico and Colombia. Rev Investig Clin Organo Hosp Enfermedades Nutr. 2022 Mar 15;74(2):071-80. [doi:10.24875/ric.21000542]
- Frimpong M, Amoako YA, Anim KB, Ahor HS, Yeboah R, Arthur J, et al. Diagnostics for COVID-19: A case for field-deployable, rapid molecular tests for community surveillance. Ghana Med J. 2020 Dec;54(4 Suppl):71-6. [doi:10.4314/gmj.v54i4s.11]
- Soni P. Effects of COVID-19 lockdown phases in India: an atmospheric perspective. Environ Dev Sustain. 2021;23(8):12044-55. [doi:10.1007/s10668-020-01156-4]
- Ghosh P, Ghosh R, Chakraborty B. COVID-19 in India: Statewise Analysis and Prediction. JMIR Public Health Surveill. 2020 Aug 12;6(3):e20341. [doi:10.2196/20341]
- COVID-19 Lockdown in India: Impact on the Poor and the Government's Response - NUS Institute of South Asian Studies (ISAS) [Internet]. [cited 2023 Dec 15]. Available from: https://www.isas.nus.edu.sg/papers/covid-19-lockdown-in-india-impact-on-the-poor-and-the-governments-response/
- Shukla M, Pandey R, Singh T, Riddleston L, Hutchinson T, Kumari V, et al. The Effect of COVID-19 and Related Lockdown Phases on Young Peoples' Worries and Emotions: Novel Data From India. Front Public Health [Internet]. 2021 [cited 2023 Dec 15];9. Available from: https://www.frontiersin.org/articles/10.3389/fpubh.2021.645183
- Ross RK, Breskin A, Westreich D. When Is a Complete-Case Approach to Missing Data Valid? The Importance of Effect-Measure Modification. Am J Epidemiol. 2020 Dec 1;189(12):1583-9. [doi:10.1093/aje/kwaa124]
- NITI-WB_Health_Index_Report_24-12-21. Available at https://social.niti.gov.in/hlt-ranking
- Minchella PA, Chipungu G, Kim AA, Sarr A, Ali H, Mwenda R, et al. Specimen origin, type, and testing laboratory are linked to longer turnaround times for HIV viral load testing in Malawi. PLOS ONE. 2017 Feb 24;12(2):e0173009. [doi:10.1371/journal.pone.0173009]
- Cherian P, Krishna S, Menon GI. Optimizing testing for COVID-19 in India. PLoS Comput Biol. 2021 Jul 22;17(7):e1009126. [doi:10.1371/journal.pcbi.1009126]

Published
Article metrics
- Views
- 779
- Downloads
- 312
Based on this site's usage statistics.