Original Article Vol. 10 No. 1 (2026): International Journal of Health Systems and Implementation Research
Epidemiological Insights and Vaccine Utilization Patterns: A Retrospective Record Review of Yellow Fever Vaccination in Eastern India (2016-2022)
Utilisation and wastage of yellow fever vaccine in Eastern India
Downloads
Topics
Keywords:
- Travellers’ vaccination, Vaccination, Vaccine wastage, Yellow fever
Abstract
Background: The yellow fever disease, an acute viral haemorrhagic illness caused by mosquitoes, is characterised by great outbreak potential, high mortality rates, and is predominantly encountered in Africa. Vaccination against yellow fever disease constitutes the cornerstone for disease control, with several countries mandating vaccination of travellers for entry. Objective: This study aimed to determine the epidemiological profile and estimate the vaccine usage and wastage rates at a designated yellow fever vaccination centre at a tertiary care institution in Eastern India. Methods: A retrospective record-based secondary analysis of the data on yellow fever vaccine recipients from 2016 and 2022 was performed. Findings: From 2016 to 2022, 19,581 individuals received the yellow fever vaccine. The majority (79.6%) were aged between 21-40 years, and 96.0% of the recipients were male. Hindus comprised the largest religious group (83.5%), and about two-thirds (66.1%) of the recipients hailed from Bihar. Africa was the most common destination (84.3%) among the vaccine recipients. Usage rates increased from 95.56% in 2016 to 100% in 2022, with a concomitant decline in wastage rates from 4.44% to 0%. Two-dose vaccine vials were the ones used most frequently (64.47%), and over four-fifths (81.97%) of the vaccine doses wasted originated from a two-dose vial. Conclusion: The study showcased a declining trend in vaccine wastage rates. Use of smaller vaccine vials will help minimise wastage and promote effective utilisation of the vaccine.
Full text
This web version was prepared from the published PDF, which is the version of record. Please cite and quote from the PDF.
Introduction
The yellow fever disease is an acute viral haemorrhagic illness primarily transmitted by the bites of mosquitoes of the Aedes and Haemagogus species [1]. The disease has an incubation period of 3 to 6 days, and many of the infected are asymptomatic. In others, it is a self-limited febrile illness characterised by symptoms like fever, muscle pain, headache, loss of appetite, nausea or vomiting that mostly disappear in 3-4 days. A small proportion of the affected enter a toxic phase characterised by multiple organ involvement and bleeding, with about half of these patients succumbing to the disease. The high chance of development of jaundice in this toxic phase lends the word “yellow” to the name of the disease. No specific anti-viral treatment exists, with the management being completely supportive in nature [2].
Yellow fever is endemic to 34 countries in Africa and 13 countries in Central and South America. It is estimated to affect around 200,000 individuals and kill about 30,000 annually, majorly in Africa [1,3]. The virus has great potential for international spread and is known to cause outbreaks with high mortality when introduced into densely populated regions with low levels of immunity [4,5]. Vaccination is thus regarded as the mainstay in the control of the disease. Several countries have mandated yellow fever vaccination for entry and require proof of the same, particularly for travellers from endemic countries [6,7].
The Central Research Institute (CRI) at Kasauli, Himachal Pradesh, is responsible for importing and distributing the vaccine to the various authorized yellow fever vaccination centres in India [8]. Immunization is performed by the subcutaneous administration of a single 0.5 ml dose of a 17D strain-derived live-attenuated vaccine. The vaccine confers lifelong immunity to the vaccinated individual, which is achieved 10 days following immunization. Consequently, this is also the period after which the vaccination certificate becomes valid. As the vaccine is cultured in chick embryos, individuals with an allergy to egg protein are contraindicated from taking the vaccine. Other contraindications to the vaccine include immune deficiency states like thymus disease, HIV, and corticosteroid use [9]. In addition, the vaccine is not recommended for children aged less than 9 months. However, children aged between 6-8 months can be vaccinated after due consideration [10]. Vaccination must also be avoided in pregnant women due to the theoretical risk of infection from a live vaccine, but the vaccine may be given if travel to high-risk endemic regions is unavoidable [11].
The vaccine is supplied in the form of freeze-dried vials of 2 doses, 5 doses and 10 doses with a diluent and needs to be reconstituted before administration. Following reconstitution, the vaccine must be discarded after 6 hours and cannot be reused. Fluctuations in daily demand and the type of vaccine vials available influence the usage and wastage rates of the yellow fever vaccine at vaccination centres. Therefore, the present study aims to describe the epidemiological profile of the vaccine recipients and to calculate the usage and wastage rates of the yellow fever vaccine at a designated yellow fever vaccination centre at a tertiary care institution in Eastern India.
Materials and methods
The present study is a retrospective secondary analysis of data obtained from the records at the Yellow Fever Vaccination Centre of a tertiary-level healthcare facility in the state of Bihar, India. The Yellow Fever Vaccination Centre at this facility has been functioning since 2016 and was the only designated centre for the states of Bihar and Jharkhand during the study period. The centre utilizes 2-dose, 5-dose, and 10-dose yellow fever vaccine vials to vaccinate individuals depending on their availability. The records of the vaccinees are maintained in physical registers at the centre, and socio-demographic details are recorded in these registers. A separate usage and wastage register records the number and type of yellow fever vaccine vials used, the number of yellow fever vaccine doses administered, and the number of yellow fever vaccine doses wasted. Information on yellow fever vaccinees, vaccine usage, and wastage for the years 2016 to 2022 was extracted from these registers, while information on the travel destination of the vaccinees was extracted from the consent forms filled out by the recipients. Data extracted were checked for accuracy, and errors, if any, were corrected on a daily basis. Socio-demographic details for 9 recipients in 2018 and 7 recipients in 2019 could not be extracted due to illegible records.
The data were recorded and cleaned in Microsoft Excel and were analysed using Jamovi v.2.3.1 software. Descriptive analysis was performed, and categorical variables were represented as frequencies and percentages.
The formulae for calculating vaccine usage and wastage rates are as follows:
Vaccine usage rate = (doses administered / doses issued) × 100
Vaccine wastage rate = 100 - vaccine usage rate
Patient and Public Involvement
The study did not involve patients or public in the design or conduct of the research. There are no plans to communicate the results to the study participants.
Ethical considerations
Ethical approval was obtained from the institutional ethics committee prior to the beginning of the study (Ref No. AIIMS/Pat/IEC/2022/922). Personal details like the name, contact number and passport number of the recipients were not extracted from the records to preserve participant confidentiality. Every individual was assigned a unique number for the purpose of the study. The principles of the Declaration of Helsinki were adhered to throughout the study.
Results
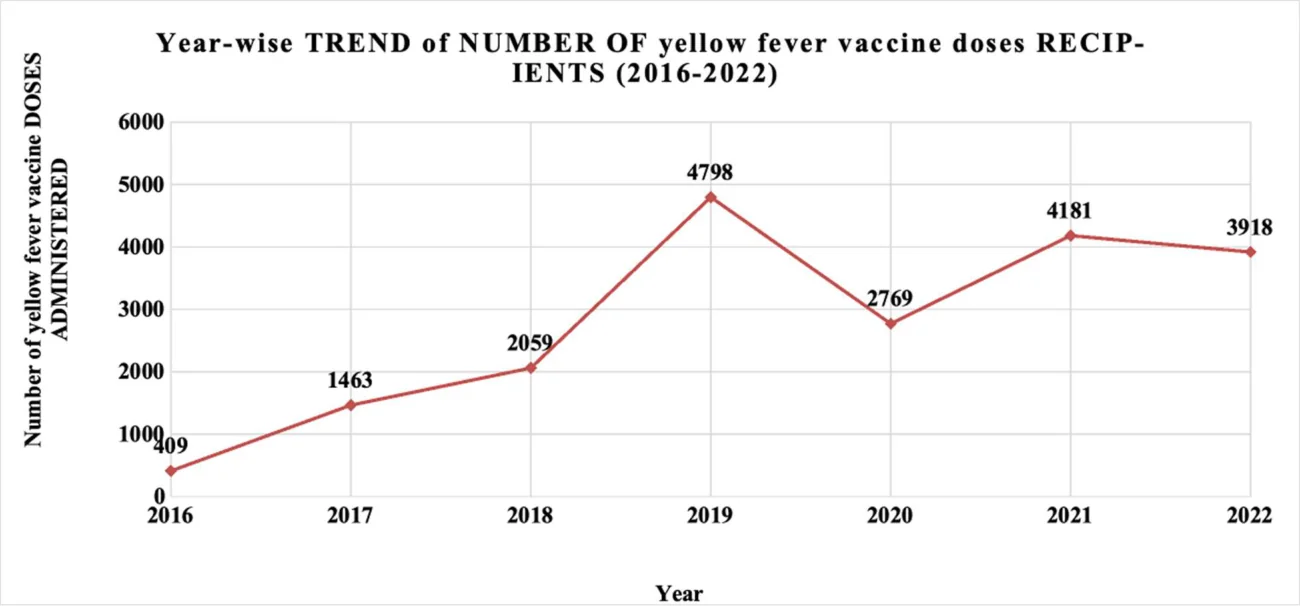
A total of 19581 recipients were administered the vaccine between 2016 and 2022 at the yellow fever vaccination centre at a tertiary-level healthcare facility in Bihar. The year-wise profile of the number of vaccine recipients is depicted in Figure 1. In 2016, 409 individuals were administered the vaccine in 2016. This number successively increased and peaked at 4791 recipients in 2019. Year 2020 saw a drop in the number of recipients, with just 2769 individuals receiving the vaccine. The number of recipients subsequently increased, reaching 4013 and 3847, respectively in 2021 and 2022.
The basic characteristics of the yellow fever vaccine recipients from 2016 to 2022 have been displayed in Table 1. Overall, 79.6% (15,594) of the recipients were aged between 21 to 40 years, with the largest proportion (45.1%, 8838) being formed by the 21-30 years group. It was observed that the 21-30 years group was the largest in each year spanning between 2016 and 2022, ranging from 42.3% in 2022 to 50.4% in 2016. The recipients were mostly male, constituting 96.0% of all recipients between 2016 to 2022. The year-wise gender distribution portrayed a similar picture, with the proportion of males ranging from 89.7% in 2016 to 97.8% in 2021. Hindus constituted the largest religious group (16345, 83.5%), followed by Muslims (3202, 16.3%) and other religions (34, 0.2%). Classification by state of residence revealed that 12943 (66.1%) of the recipients resided in Bihar, followed by Jharkhand (2938, 15.0%), Uttar Pradesh (2455, 12.5%) and West Bengal (746, 3.8%).
The year-wise trend of the number of yellow fever vaccine recipients by state of residence revealed that Bihar accounted for the largest share of recipients every year. However, Jharkhand showed an increasing trend in the proportion of vaccine recipients, increasing from 0.2% in 2016 to 16.7% in 2022, with a peak of 21.1% in 2019. In contrast, Uttar Pradesh displayed a declining trend, with its share dropping from 41.1% in 2016 to 11.5% in 2022. The continent of Africa was found to be the most common destination among the yellow fever vaccine recipients (15535, 84.3%), followed by Asia (1130, 5.8%) and The Americas (92, 0.5%); 13.2% of the vaccine recipients were seafarers.
| Variable | n (%) | |||||||
|---|---|---|---|---|---|---|---|---|
| 2016 | 2017 | 2018 | 2019 | 2020 | 2021 | 2022 | Total | |
| Age | ||||||||
| 9 mo - 10 years | 7 (1.7%) | 46 (3.1%) | 52 (2.5%) | 61 (1.3%) | 36 (1.3%) | 37 (0.9%) | 59 (1.5%) | 298 (1.5%) |
| 11 - 20 years | 28 (6.8%) | 126 (8.6%) | 156 (7.6%) | 326 (6.8%) | 154 (5.6%) | 210 (5.0%) | 225 (5.7%) | 1225 (6.3%) |
| 21 - 30 years | 206 (50.4%) | 646 (44.2%) | 903 (44.0%) | 2173 (45.4%) | 1242 (44.9%) | 2009 (48.1%) | 1659 (42.3%) | 8838 (45.1%) |
| 31 - 40 years | 113 (27.6%) | 424 (29.0%) | 629 (30.7%) | 1677 (35.0%) | 1037 (37.5%) | 1453 (34.8%) | 1423 (36.3%) | 6756 (34.5%) |
| 41 - 50 years | 37 (9.0%) | 143 (9.8%) | 207 (10.1%) | 465 (9.7%) | 270 (9.8%) | 405 (9.7%) | 453 (11.6%) | 1980 (10.1%) |
| 51 - 60 years | 7 (1.7%) | 30 (2.1%) | 73 (3.6%) | 61 (1.3%) | 24 (0.9%) | 48 (1.1%) | 77 (2.0%) | 320 (1.6%) |
| 61 - 70 years | 8 (2.0%) | 43 (2.9%) | 26 (1.3%) | 17 (0.4%) | 4 (0.1%) | 14 (0.3%) | 15 (0.4%) | 127 (0.6%) |
| ≥ 71 years | 3 (0.7%) | 5 (0.3%) | 4 (0.2%) | 5 (0.1%) | 2 (0.1%) | 5 (0.1%) | 7 (0.2%) | 31 (0.2%) |
| Gender | ||||||||
| Male | 367 (89.7%) | 1339 (91.5%) | 1883 (91.9%) | 4636 (96.8%) | 2694 (97.3%) | 4087 (97.8%) | 3788 (96.7%) | 18794 (96.0%) |
| Female | 42 (10.3%) | 124 (8.5%) | 167 (8.1%) | 155 (3.2%) | 75 (2.7%) | 94 (2.2%) | 130 (3.3%) | 787 (4.0%) |
| Religion | ||||||||
| Hindu | 353 (86.3%) | 1204 (82.3%) | 1713 (83.6%) | 3981 (83.1%) | 2385 (86.1%) | 3448 (82.5%) | 3261 (83.2%) | 16345 (83.5%) |
| Muslim | 54 (13.2%) | 255 (17.4%) | 332 (16.2%) | 799 (16.7%) | 382 (13.8%) | 730 (17.4%) | 650 (16.6%) | 3202 (16.3%) |
| Others | 2 (0.5%) | 4 (0.3%) | 5 (0.2%) | 11 (0.2%) | 2 (0.1%) | 3 (0.1%) | 7 (0.2%) | 34 (0.2%) |
| State of residence | ||||||||
| Bihar | 233 (57.0%) | 999 (68.3%) | 1546 (75.4%) | 3009 (62.8%) | 1880 (67.9%) | 2651 (63.4%) | 2625 (67.0%) | 12943 (66.1%) |
| Uttar Pradesh | 168 (41.1%) | 266 (18.2%) | 284 (13.9%) | 421 (8.8%) | 360 (13.0%) | 504 (12.1%) | 452 (11.5%) | 2455 (12.5%) |
| Jharkhand | 1 (0.2%) | 39 (2.7%) | 118 (5.8%) | 1013 (21.1%) | 406 (14.7%) | 707 (16.9%) | 654 (16.7%) | 2938 (15.0%) |
| West Bengal | 0 (0.0%) | 108 (7.4%) | 25 (1.2%) | 221 (4.6%) | 64 (2.3%) | 233 (5.6%) | 95 (2.4%) | 746 (3.8%) |
| Others | 7 (1.7%) | 51 (3.5%) | 77 (3.8%) | 127 (2.7%) | 59 (2.1%) | 86 (2.1%) | 92 (2.3%) | 499 (2.5%) |
| Place of visit | ||||||||
| Africa | 352 (86.1%) | 1249 (85.4%) | 1734 (84.6%) | 4020 (83.9%) | 2334 (84.3%) | 3521 (84.2%) | 3297 (84.2%) | 16507 (84.3%) |
| Asia | 12 (2.9%) | 92 (6.3%) | 125 (6.1%) | 290 (6.0%) | 141 (5.1%) | 230 (5.5%) | 240 (6.1%) | 1130 (5.8%) |
| The Americas | 3 (0.7%) | 7 (0.5%) | 7 (0.3%) | 36 (0.8%) | 14 (0.5%) | 18 (0.4%) | 13 (0.3%) | 98 (0.5%) |
| Seafarer | 42 (10.3%) | 115 (7.8%) | 184 (9.0%) | 445 (9.3%) | 280 (10.1%) | 412 (9.9%) | 368 (9.4%) | 1846 (9.4%) |
Source: Data extracted from Yellow Fever Vaccination Centre registers, AIIMS Patna, Bihar
Table 2. highlights the yellow fever vaccine usage and wastage rates. Usage and wastage rates were calculated as per the formulae described above. Over the study period of seven years, i.e., 2016-2022, it was seen that the overall usage rate was 98.52% with a wastage rate of 1.48%. The year-wise rates revealed an increasing trend for the usage rates, beginning at 95.56% in 2016 and reaching 100% in 2022. Conversely, the wastage rates displayed a declining trend, with the highest wastage rate of 4.44% being observed in 2016. The wastage rate subsequently decreased to zero percent in 2022, apart from a minor deflection in the opposite direction in 2018.
| Year | Total number of doses issued (a) | Total number of doses used (b) | Total number of doses wasted (c) | Usage rate (b/a * 100) | Wastage rate (c/a * 100) |
|---|---|---|---|---|---|
| 2016 | 428 | 409 | 19 | 95.56% | 4.44% |
| 2017 | 1524 | 1463 | 61 | 95.98% | 4.02% |
| 2018 | 2150 | 2059 | 91 | 95.77% | 4.23% |
| 2019 | 4860 | 4798 | 62 | 98.73% | 1.27% |
| 2020 | 2800 | 2769 | 31 | 98.89% | 1.11% |
| 2021 | 4211 | 4181 | 30 | 99.29% | 0.71% |
| 2022 | 3918 | 3918 | 0 | 100% | 0 |
| Total | 19,891 | 19,597 | 294 | 98.52% | 1.48% |
Source: Data extracted from Yellow Fever Vaccination Centre registers, AIIMS Patna, Bihar
Analysing the use of yellow fever vaccine by vial type revealed that two-dose vaccine vials were the most frequently used, constituting 64.47% of all vials used, followed by the five-dose vaccine vials (26.37%) and the ten-dose vaccine vials (9.16%). Year-wise vaccine vial usage information is depicted in Table 3. The trend of yellow fever vaccine dose wastage by type of vial is described in Table 4. It was observed that 81.97% of all vaccine doses wasted were from a two-dose vaccine vial, while 13.25% and 5.78% of all vaccine doses wasted were from ten-dose vials and five-dose vials, respectively.
| Year | 2DV used | 5DV used | 10DV used | Total number of vials used |
|---|---|---|---|---|
| 2016 | 19 (32.76%) | 0 (0.0%) | 39 (67.24%) | 58 (100.0%) |
| 2017 | 557 (93.14%) | 0 (0.0%) | 41 (6.86%) | 598 (100.0%) |
| 2018 | 585 (81.55%) | 0 (0.0%) | 98 (18.45%) | 683 (100.0%) |
| 2019 | 465 (46.36%) | 290 (28.91%) | 248 (24.77%) | 1003 (100.0%) |
| 2020 | 514 (66.24%) | 172 (22.16%) | 90 (11.60%) | 776 (100.0%) |
| 2021 | 788 (60.01%) | 525 (39.99%) | 0 | 1313 (100.0%) |
| 2022 | 708 (58.61%) | 500 (41.39%) | 0 | 1208 (100.0%) |
| Total | 3636 (64.47%) | 1487 (26.37%) | 516 (9.16%) | 5639 (100.0%) |
Source: Data extracted from Yellow Fever Vaccination Centre registers, AIIMS Patna, Bihar
| Year | 2DV doses wasted | 5DV doses wasted | 10DV doses wasted | Total number of doses wasted |
|---|---|---|---|---|
| 2016 | 4 (21.05%) | 0 (0.0%) | 15 (78.95%) | 19 (100.0%) |
| 2017 | 49 (80.33%) | 0 (0.0%) | 12 (19.67%) | 61 (100.0%) |
| 2018 | 91 (100.0%) | 0 | 0 | 91 (100.0%) |
| 2019 | 48 (77.42%) | 5 (8.06%) | 9 (14.52%) | 62 (100.0%) |
| 2020 | 21 (67.74%) | 10 (32.26%) | 0 | 31 (100.0%) |
| 2021 | 28 (93.34%) | 2 (6.66%) | 0 | 30 (100.0%) |
| 2022 | 0 | 0 | 0 | 0 |
| Total | 241 (81.97%) | 17 (5.78%) | 36 (13.25%) | 294 (100.0%) |
Source: Data extracted from Yellow Fever Vaccination Centre registers, AIIMS Patna, Bihar
2DV: 2-dose vaccine vial
5DV: 5-dose vaccine vial
10DV: 10-dose vaccine vial
Discussion
The present study details the basic socio-demographic profile of the yellow fever vaccine recipients attending a yellow fever vaccination centre in a tertiary hospital between 2016 and 2022. The yearly trend of the number of vaccinations at the centre showed a consistent rise since the centre’s inception, peaking in 2019 and then suffering a fall in the year 2020. This fall in vaccination can be attributed to the COVID-19 pandemic, which caused widespread disruptions in routine healthcare services and resulted in lockdowns which curtailed the movement and travel of individuals [12]. To further substantiate this, demand at the centre subsequently picked up and reached pre-pandemic levels in 2021 and 2022. Most of the recipients were male and aged between 21-50 years, an economically productive age group. Historically, Bihar has seen large amounts of outward migration by its population in pursuit of economic and employment opportunities [13]. This could explain the predominance of this age range in our vaccine population and is consistent with a study done in Jammu & Kashmir, India [14]. Furthermore, migration is highly masculinized which would account for the fact that 96.0% of the study participants were male [15]. Hindus constituted the largest religious group in our study, followed by Muslims. The religion structure of our study population mirrors that of Bihar, and the broader structure of India where Hinduism is the most practised religion, followed by Islam [16].
Categorization of the vaccine recipients by state of residence showed that almost two-thirds of the recipients hailed from Bihar, followed by Jharkhand, Uttar Pradesh, and West Bengal. The number of vaccine recipients from Uttar Pradesh between 2017 and 2022 was seen to almost double, whereas the number of recipients from Jharkhand increased by a magnitude of 20 times. The number of vaccination recipients from West Bengal showed an inconsistent, fluctuating pattern during the same period. Changes in interstate demand may be influenced by a variety of factors like proximity from the centre, unavailability of vaccine in a nearby centre, and better transportation options. The place of visit for more than three-fourths of the recipients was an African country, and about one-sixth were seafarers. Our findings parallel those of Dkhar et al., who reported that the place of visit was Africa for 93% of the study participants [14]. Africa houses 34 of the 47 countries endemic for yellow fever, explaining its predominance as a destination for the recipients at our centres [16,17].
The overall wastage rate at our centre was determined to be 1.48%, a figure lower than the one reported by the study done in Jammu & Kashmir [14]. Furthermore, this figure is also much lower compared to wastage rates reported by other centres across the world [18-20]. However, these studies were performed in centres located in countries endemic for yellow fever. India is not endemic for yellow fever, and thus the yellow fever vaccine is reserved for travellers and not administered routinely. The lower rates of vaccine wastage at our centre can partly be attributed to this fact. Our centre also witnesses a high demand for the yellow fever vaccine, which could further reduce the occurrence of vaccine wastage. The highest wastage rate in our centre of 4.44% occurred in 2016, the year of inception. Apart from the exceptional circumstances experienced in the year 2020, our centre has witnessed a consistent surge in vaccine demand with a concomitant fall in wastage rates. The wastage rate at our centre in 2022 was zero percent and was mainly the result of an internal policy decision that aimed at zero vaccine wastage. During this period, our vaccination centre experienced a periodic unavailability of vaccine due to disruptions in supply. In the wake of this short supply, it was decided to adopt a zero-wastage policy to prevent wastage of vaccine doses, which could in turn benefit a greater number of individuals. The complete elimination of vaccine wastage was achieved by limiting the number of registrations for the vaccine based on the type of vaccine vials available.
Of the 294 vaccine doses wasted, 81.97% of the doses wasted originated from a two-dose vaccine vial. Year-wise distributions also show that the wastage of doses majorly originated from a two-dose vial, except for the year 2016, where 78.95% of the doses wasted originated from a ten-dose vial. These figures might suggest that the use of two-dose vials is associated with wastage; however, two-dose vials constituted 64.57% of all vials used over the study period. Except for 2016, two-dose vials were the largest type used by share every year. In 2016, where most wasted doses originated from a ten-dose vial, these vials constituted 67.24% of all vials used that year. Therefore, it is apparent that wastage is mainly due to greater use of a particular type of vial rather than its inherent nature.
A greater share of wastage emanating from the use of two-dose vials is a positive finding, as the maximum number of doses that can be wasted by using a two-dose vial is one dose, or two doses if a vial is inadvertently opened in the absence of a recipient. Supposing 5-dose vials and 10-dose vials were used in a similar situation, this could have resulted in a wastage as high as four doses and nine doses per vial. The use of two-dose vials thus ensures optimum and judicious use of vaccine while simultaneously minimising wastage. The wastage rates in the earlier years at our centre could have been further minimized if more 2-dose vials were available. The use of vials with a smaller number of doses must be encouraged universally, and especially in centres that report high wastage rates. Notably, the Ministry of Health and Family Welfare (MoHFW), Government of India (GoI), has permissible wastage recommendations in place for vaccines included in the National Immunization Schedule (NIS) [21]. However, such a recommendation does not exist for the yellow fever vaccine; formulating a recommendation can thus play a supportive role in reducing wastage levels across the designated centres for yellow fever vaccination.
The primary strength of our study is the long study period and the size of our study population. We were able to find just one study on yellow fever vaccination in India, which was performed in Jammu & Kashmir [14]. However, the study population and duration of this study were much smaller. However, being a single-centre study, our findings may not be directly generalizable to other centres across the country. Another limitation was the inability to extract a few records due to illegibility, but since their number is minimal compared to the overall number of records, they are not expected to alter the study findings significantly.
Conflict of Interest
No conflict of interest declared.
Funding
Nil
References
- Yellow fever [Internet]. [cited 2023 Aug 15]. Available from: https://www.who.int/news-room/fact-sheets/detail/yellow-fever
- Yellow Fever - PAHO/WHO | Pan American Health Organization [Internet]. [cited 2023 Aug 15]. Available from: https://www.paho.org/en/topics/yellow-fever
- Global Health - Newsroom - Yellow Fever [Internet]. 2019 [cited 2023 Aug 15]. Available from: https://www.cdc.gov/globalhealth/newsroom/topics/yellowfever/index.html
- Nwachukwu William E, Oladejo J, Ofoegbunam CM, Anueyiagu C, Dogunro F, Etiki SO, et al. Epidemiological description of and response to a large yellow fever outbreak in Edo state Nigeria, September 2018 - January 2019. BMC Public Health. 2022 Aug 30;22(1):1644.
- Wilder-Smith A, Monath TP. Responding to the threat of urban yellow fever outbreaks. Lancet Infect Dis. 2017 Mar 1;17(3):248–50.
- Yellow fever, the returning epidemic - PAHO/WHO | Pan American Health Organization [Internet]. [cited 2023 Oct 15]. Available from: https://www.paho.org/en/stories/yellow-fever-returning-epidemic
- Countries with risk of yellow fever transmission and countries requiring yellow fever vaccination (November 2022) [Internet]. [cited 2023 Oct 15]. Available from: https://www.who.int/publications/m/item/countries-with-risk-of-yellow-fever-transmission-and-countries-requiring-yellow-fever-vaccination-(november-2022)
- Yellow Fever Vaccine || Central Research Institute [Internet]. [cited 2023 Oct 15]. Available from: https://crikasauli.nic.in/Yellow%20Fever%20Vaccine
- IHR POE [Internet]. [cited 2023 Oct 15]. Available from: https://www.ihpoe.mohfw.gov.in/vaccination.php
- Vaccine Recommendations for Infants & Children | CDC Yellow Book 2024 [Internet]. [cited 2023 Oct 15]. Available from: https://wwwnc.cdc.gov/travel/yellowbook/2024/family/vaccine-recommendations-for-infants-and-children
- Yellow Fever Vaccine [Internet]. [cited 2023 Oct 15]. Available from: https://www.cdc.gov/MMWR/preview/mmwrhtml/rr5907a1.htm
- Kapoor M, Nidhi Kaur K, Saeed S, Shannawaz M, Chandra A. Impact of COVID-19 on healthcare system in India: A systematic review. J Public Health Res. 2023 Jul 13;12(3):22799036231186349.
- Datta A. Migration from Rural Bihar: Insights from a Longitudinal Study (1981–2011). In: Himanshu, Jha P, Rodgers G, editors. The Changing Village in India: Insights from Longitudinal Research [Internet]. Oxford University Press; 2016 [cited 2023 Dec 8]. p. 0. Available from: https://doi.org/10.1093/acprof:oso/9780199461868.003.0014
- Dkhar SA, Quansar R, Haq I, Khan SMS. Vaccine usage and wastage in a designated Yellow Fever Vaccination Centre in North India. Clin Exp Vaccine Res. 2021 Sep;10(3):240–4.
- Datta A. Circular Migration and Precarity: Perspectives from Rural Bihar. Indian J Labour Econ. 2020;63(4):1143–63.
- Center PR. 3. Religious demography of Indian states and territories [Internet]. Pew Research Center’s Religion & Public Life Project. 2021 [cited 2023 Dec 8]. Available from: https://www.pewresearch.org/religion/2021/09/21/religious-demography-of-indian-states-and-territories/
- Center PR. 1. Population growth and religious composition [Internet]. Pew Research Center’s Religion & Public Life Project. 2021 [cited 2023 Dec 8]. Available from: https://www.pewresearch.org/religion/2021/09/21/population-growth-and-religious-composition/
- Mai S, Rosa RDS, Carvalho A da S, Herrmann F, Ramos AR, Micheletti VCD, et al. Vaccine dose usage and wastage in the Metropolitan Region of Porto Alegre, Rio Grande do Sul, Brazil: a descriptive study, 2015-2017. Epidemiol E Serv Saude Rev Sist Unico Saude Bras. 2020;28(3):e2018389.
- Usuf E, Mackenzie G, Ceesay L, Sowe D, Kampmann B, Roca A. Vaccine wastage in The Gambia: a prospective observational study. BMC Public Health. 2018 Jul 11;18:864.
- Nkenyi R, Pak GD, Tonga C, Chon Y, Park SE, Kang S. A retrospective review of vaccine wastage and associated risk factors in the Littoral region of Cameroon during 2016–2017. BMC Public Health. 2022 Oct 23;22(1):1956.
- Guidelines- Immunization :: National Health Mission [Internet]. [cited 2024 Jan 20]. Available from: https://nhm.gov.in/index1.php?lang=1&level=3&sublinkid=944&lid=378
Supplementary material
| Item | Item No | Recommendation | Page No |
|---|---|---|---|
| Title and abstract | 1 | (a) Indicate the study’s design with a commonly used term in the title or the abstract | 1 |
| (b) Provide in the abstract an informative and balanced summary of what was done and what was found | 1 | ||
| Introduction | |||
| Background/ rationale | 2 | Explain the scientific background and rationale for the investigation being reported | 3 |
| Objectives | 3 | State-specific objectives, including any prespecified hypotheses | 3 |
| Methods | |||
| Study design | 4 | Present key elements of study design early in the paper | 1 |
| Setting | 5 | Describe the setting, locations, and relevant dates, including periods of recruitment, exposure, follow-up, and data collection | 4 |
| Participants | 6 | (a) Cohort study—Give the eligibility criteria, and the sources and methods of selection of participants. Describe methods of follow-up Case-control study—Give the eligibility criteria, and the sources and methods of case ascertainment and control selection. Give the rationale for the choice of cases and controls Cross-sectional study—Give the eligibility criteria, and the sources and methods of selection of participants | 4 |
| (b) Cohort study—For matched studies, give matching criteria and number of exposed and unexposed Case-control study—For matched studies, give matching criteria and the number of controls per case | |||
| Variables | 7 | Clearly define all outcomes, exposures, predictors, potential confounders, and effect modifiers. Give diagnostic criteria, if applicable | 5 |
| Data sources/ measurement | 8* | For each variable of interest, give sources of data and details of methods of assessment (measurement). Describe comparability of assessment methods if there is more than one group | 4 |
| Bias | 9 | Describe any efforts to address potential sources of bias | 5 |
| Study size | 10 | Explain how the study size was arrived at | NA |
| Quantitative variables | 11 | Explain how quantitative variables were handled in the analyses. If applicable, describe which groupings were chosen and why | 5 |
| Statistical methods | 12 | (a) Describe all statistical methods, including those used to control for confounding | 5 |
| (b) Describe any methods used to examine subgroups and interactions | NA | ||
| (c) Explain how missing data were addressed | 5 | ||
| (d) Cohort study—If applicable, explain how loss to follow-up was addressed Case-control study—If applicable, explain how matching of cases and controls was addressed Cross-sectional study—If applicable, describe analytical methods taking account of sampling strategy | NA | ||
| (e) Describe any sensitivity analyses | NA | ||
| Results | |||
| Participants | 13* | (a) Report numbers of individuals at each stage of study—eg numbers potentially eligible, examined for eligibility, confirmed eligible, included in the study, completing follow-up, and analysed | NA |
| (b) Give reasons for non-participation at each stage | NA | ||
| (c) Consider use of a flow diagram | NA | ||
| Descriptive data | 14* | (a) Give characteristics of study participants (eg demographic, clinical, social) and information on exposures and potential confounders | 7 |
| (b) Indicate number of participants with missing data for each variable of interest | 5 | ||
| (c) Cohort study—Summarise follow-up time (eg, average and total amount) | NA | ||
| Outcome data | 15* | Cohort study—Report numbers of outcome events or summary measures over time | NA |
| Case-control study—Report numbers in each exposure category, or summary measures of exposure | NA | ||
| Cross-sectional study—Report numbers of outcome events or summary measures | 6-9 | ||
| Main results | 16 | (a) Give unadjusted estimates and, if applicable, confounder-adjusted estimates and their precision (eg, 95% confidence interval). Make clear which confounders were adjusted for and why they were included | NA |
| (b) Report category boundaries when continuous variables were categorized | 7 | ||
| (c) If relevant, consider translating estimates of relative risk into absolute risk for a meaningful time period | NA | ||
| Other analyses | 17 | Report other analyses done—eg analyses of subgroups and interactions, and sensitivity analyses | NA |
| Discussion | |||
| Key results | 18 | Summarise key results with reference to study objectives | 6-9 |
| Limitations | 19 | Discuss limitations of the study, taking into account sources of potential bias or imprecision. Discuss both direction and magnitude of any potential bias | 13 |
| Interpretation | 20 | Give a cautious overall interpretation of results considering objectives, limitations, multiplicity of analyses, results from similar studies, and other relevant evidence | 10-13 |
| Generalisability | 21 | Discuss the generalisability (external validity) of the study results | 13 |
| Other information | |||
| Funding | 22 | Give the source of funding and the role of the funders for the present study and, if applicable, for the original study on which the present article is based | NA |
*Give information separately for cases and controls in case-control studies and, if applicable, for exposed and unexposed groups in cohort and cross-sectional studies.
Note: An Explanation and Elaboration article discusses each checklist item and gives methodological background and published examples of transparent reporting. The STROBE checklist is best used in conjunction with this article (freely available on the Web sites of PLoS Medicine at http://www.plosmedicine.org/, Annals of Internal Medicine at http://www.annals.org/, and Epidemiology at http://www.epidem.com/). Information on the STROBE Initiative is available at www.strobe-statement.org.

Published
Article metrics
- Views
- 114
- Downloads
- 33
Based on this site's usage statistics.
Issue
Section
How to Cite
License
Copyright (c) 2026 Shreyas Patil, Deepika Agrawal, Purushottam Kumar, Pragya Kumar, Shamshad Ahmad

This work is licensed under a Creative Commons Attribution 4.0 International License.